Range in Statistics
When you buy things, they are always sold within a price range. Take the example of your favourite pair of jeans. The store from where you made the purchase probably had a range of colors, a range of fits, a range of sizes, and a range of prices.
This range usually enables us to make a more informed decision about what exactly - in this case a pair of jeans - we want to buy.
Range is usually defined with an upper value and lower value and it refers to all the units between those values.

With this example, let's move ahead to know more about range in statistics.
In this mini-lesson, we shall explore the topic of range in statistics, by finding answers to questions like what is meant by range in statistics, how to find range in statistics, what is the rule of thumb to find the range, and what are the limitations of range.
Lesson Plan
What is Meant by Range in Statistics?
The range is the difference between the highest value and the lowest value of the data. It helps in knowing the spread of the data.
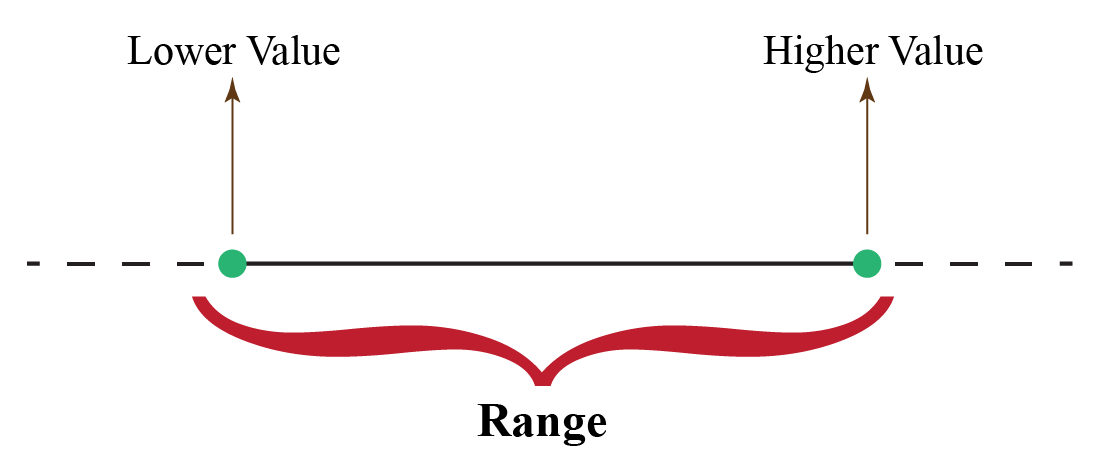
\[\text{Range = Highest Value - Lowest Value} \]
Example
Find the range of the data 2, 7, 11, 12, 19, 22, 25, 27, 33, 35
Highest Value = 35
Lowest Value = 2
Range = Highest Value - Lowest Value = 35 - 2 = 33
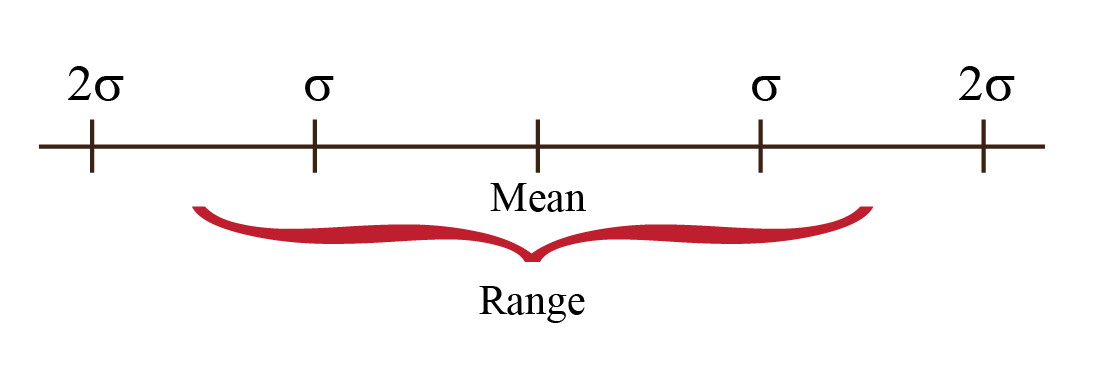
What is Rule of Thumb?
As per the rule of thumb, the range of data lies within four standard deviations. Two standard deviations above the mean and two standard deviations below the mean.
The formula for Standard Deviation \((\sigma ) \) is as follows. \[\sigma = \sqrt{\dfrac{x_i - \mu}{N}}\]

- Range is the difference of the highest value and the lowest value of the data.
- Range is useful to find the class interval(CI). \[ CI = \dfrac{Range}{\text{Number of classes}}\]
- For data having outliers, Interquartile range is used to represent the data.
- Interquartile range is the difference between the first quartile and the third quartile.
- Outliers refers to the extreme values in the data.
What Are the Limitations of Range?
Range is the most convenient metric to find. But it has the following limitations.
- The range does not tell us the number of data points.
- The range cannot be used to find mean, median, or mode.
- The range is affected by extreme values(outliers).
- The range cannot be used for open-ended distribution.
Solved Examples
| Example 1 |
Joseph wishes to find the range of the first 40 multiples of 3. Can you help Joseph to find the range?
Solution
Let us first list the first 40 multiples of the number 3
3, 6, 9, 12, .......114, 117, 120
Here the Lowest Value = 3 and the Highest Value = 120
Range = Highest Value - Lowest Value = 120 - 3 = 117
| \(\therefore \) Range = 117 |
| Example 2 |
Peter finds the highest price of a varient of potato is 79 cents and the lowest price for another range of potato is 36 cents. Find the price range of the potatoes.
Solution
Given the highest price = 79 and the lowest price = 36
Price range = Highest price - Lowest price = 79 - 36 = 43
| \(\therefore\) The price range is 43 |
| Example 3 |
The marks scored by students of a class is 3, 4, 42, 47, 51, 55, 57, 63, 69, 74, 74, 75, 97. Find the outliers of the data. Also find the range of the data, after removing the outliers.
Solution
The marks scored by the students is:
3, 4, 42, 47, 51, 55, 57, 63, 69, 74, 74, 75, 97
Here the numbers 3, 4, and 97 are the outliers.
After removing the outliers the remaining data is as follows.
42, 47, 51, 55, 57, 63, 69, 74, 74, 75
Here we have the Highest Score = 75 and the Lowest Score = 42
Range = Highest Score - Lowest Score = 75 - 42 = 33
| \(\therefore\) The range of the remaining data is 33 |

Interquartile Range: This is used to eliminate the outliers and give a better representation of data. IQR is the difference between the first quartile and the third quartile of the data.
For data having outliers, the Interquartile Range is used in place of range.
Find the interquartile range for the data 14, 12, 27, 33, 2, 45, 65, 21, 39, 98, 52. 47, 25, 33, 21, 54, 82, 77
Interactive Questions on Range in Statistics
Here are a few activities for you to practice. Select/Type your answer and click the "Check Answer" button to see the result.
Let's Summarize
The mini-lesson targeted the fascinating concept of range in statistics. The math journey around range in statistics starts with what a student already knows, and goes on to creatively crafting a fresh concept in the young minds. Done in a way that not only it is relatable and easy to grasp, but also will stay with them forever. Here lies the magic with Cuemath.
About Cuemath
At Cuemath, our team of math experts is dedicated to making learning fun for our favorite readers, the students!
Through an interactive and engaging learning-teaching-learning approach, the teachers explore all angles of a topic.
Be it worksheets, online classes, doubt sessions, or any other form of relation, it’s the logical thinking and smart learning approach that we, at Cuemath, believe in.
FAQs on Range in Statistics
1. What is the range in math?
The range in math is the difference between the highest value datapoint and the lowest value datapoint of the given data.
2. What is the use of range?
Range helps us to know the spread of the data. It also helps us to identify if the given data point is within the defined range or not.
3. What does the range in statistics tell us?
The range in statistics tells us the size of the data. Also for a given end datapoint of the data, we can find the other end data point, with the help of range.
4. How do you find the range in statistics?
The process of finding range is statistics can be simplified in three quick steps.
- Arrange the given data in ascending order or descending order.
- Identify the lowest highest value of the data.
- Find the difference between the lowest and the highest data point, to get the range.
5. Why is range important?
Range helps to define the spread of the data. Knowing the range helps to define the scale to represent the data.
6. What is the practical utility of range?
The range is practically used to know the capacity. Range helps to know the minimum and maximum capacity.
7. Do outliers count in range?
Outliers are generally included in the range. Further to avoid outliers a new quantity called interquartile range is used.
- Live one on one classroom and doubt clearing
- Practice worksheets in and after class for conceptual clarity
- Personalized curriculum to keep up with school