
MAP testing and RIT scores: what the number means for placement
The MAP report came home with a RIT score and no plain answer to whether it decides next year's math class. In the five districts we verified, it never decides alone. Here is what each one actually does with the number.

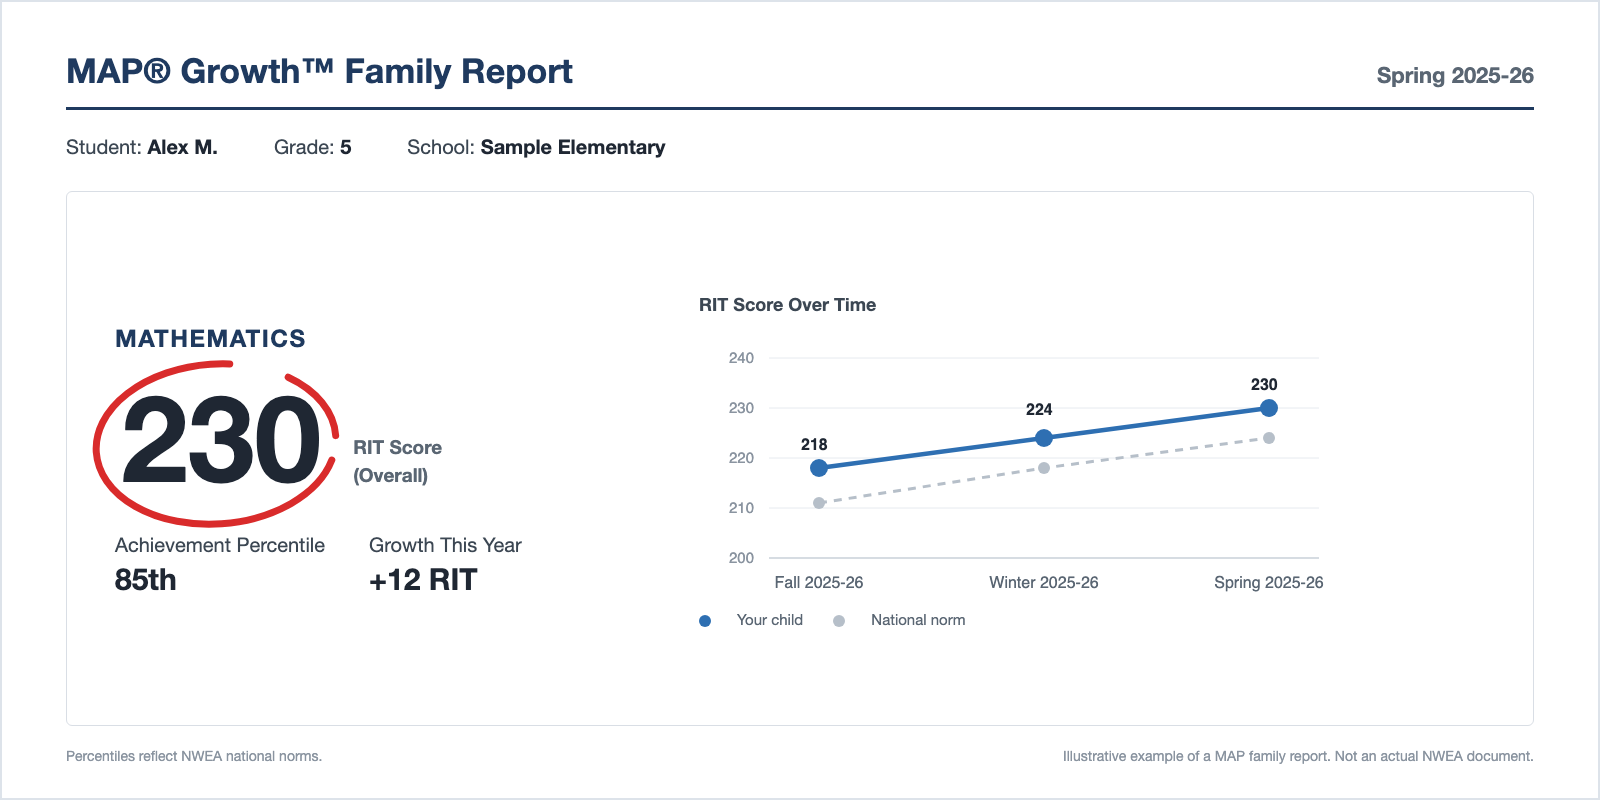
The MAP score report came home. There is a number called a RIT score, usually a percentile next to it, and no plain answer to the question you actually have: does this number decide which math class my child takes next year?
Short answer: not by itself. In the districts we verified, the RIT number never decides placement alone. What it counts for, and how much, is set by your district's own published placement rules. Those rules differ more than most parents expect. Below is what five districts actually do with the number, including one that has just swapped to a different test, so you know exactly what to ask your own.
- The two numbers on the report
- What districts actually do with the score
- San Jose Unified: a point matrix
- Cupertino Union: exact cut scores, never alone
- Sunnyvale: a recommendation the family can overrule
- Fairfax County: information, not a gate
- San Mateo Union: the score follows into high school
- What the percentile means, and what it does not
- Five questions for your school
- Where Cuemath fits
- FAQs
The two numbers on the report
MAP is a test made by NWEA. The score it reports is called a RIT score. Districts use it in two forms.
Some set cut scores on the RIT number itself. Cupertino Union in California, for example, uses thresholds like 235 and 250 for its accelerated courses. (If what you actually want is practice for the test rather than what the score does afterwards, that is a different question and we cover it in MAP test practice.) Others convert the score into a national percentile first, then award points by band. San Jose Unified reads a spring percentile that way, but no longer from MAP: its 2026-2027 criteria score the i-Ready Diagnostic on those bands, where the earlier cycle scored the NWEA Spring RIT. Our i-Ready vs MAP page explains why the two numbers cannot be swapped. Fairfax County in Virginia points families at the whole report: RIT score, percentile, and growth.
So the percentile compares your child to NWEA's national norms, not to the class down the hall. And the same score can mean different things in different districts, because the placement rule is local. That is the part to focus on.
What districts actually do with the score
Placement practice varies district by district. These five are the ones we verified against their own published pages, checked across July and August 2026. Your district may work differently. That is the point: look up its rule, not a generic chart.
| District | What the MAP score does | The numbers involved |
|---|---|---|
| San Jose Unified | Nothing now: for 2026-2027 the district moved its point matrix onto the i-Ready Diagnostic - the biggest single input there, never enough alone | i-Ready 90th percentile earns 3 of the 5 points needed; one point short brings a challenge assessment offer |
| Cupertino Union | Exact RIT cut scores, each sitting alongside a placement test and semester grades | 235 for Math 7+, 250 for Algebra 1 in 7th, 240 for Algebra 1 in 8th, 260 for Geometry |
| Sunnyvale | Feeds a recommendation; the family makes the final enrollment decision | 95th percentile named only as guidance for the optional placement assessment |
| Fairfax County | Reading material for the family's own decision; middle school honors has no score gate | None published; all 7th graders can enroll in Math 7 Honors |
| San Mateo Union (high school) | One recommended criterion among several for the compressed pathway | RIT of at least 250, alongside a CAASPP of at least 2600 and an A in Algebra 1 |
Verified against each district's own published placement pages, July and August 2026. Rules change; check your district's current page.
San Jose Unified: a point matrix
San Jose Unified turns a diagnostic score into points, and of the measures it scores, that one is worth the most. It is no longer the MAP: the district's 2026-2027 criteria run the same percentile bands on the i-Ready Diagnostic, where the earlier cycle used the NWEA RIT. For entry to Accelerated Math 6, three measures count. The grade 5 spring i-Ready Diagnostic earns 3 points at or above the 90th percentile, 2 points at the 80th, 1 point at the 70th. The math CAASPP from grade 4 or 5, whichever is higher, adds 2 points for a score of 4 and 1 point for a 3. The grade 5 winter progress report, issued in February, adds 1 point for adequate progress in math. Six points are on the table, and 5 or more places a child into Accelerated Math 6.
A year later the same machinery decides 7th grade, on four measures instead of three: the grade 5 or 6 CAASPP, the grade 6 spring i-Ready on the same percentile bands, the first-semester grade 6 math grade (A or B is 2 points, C is 1), and 1 point for having been in Accelerated Math 6. Five points place a child into Accelerated Math 7. Six or more place them into Algebra 1.
Read that again from a parent's chair: a child at the 90th percentile nationally holds 3 of the 5 points needed. The strongest diagnostic result on the table still does not place a child by itself.
And four points is not a closed door. A child who lands one point short, at either grade, is offered a challenge assessment. The 2026-2027 criteria set two conditions and no others. First: "Students must be within one point of the acceleration criteria to take the assessment (4 points - incoming 6th and 7th grade)." Second: "Students who score a 70% or higher on the Challenge Assessment will be placed in the accelerated course for grades 6 and 7." No notification date is published for children already in the district; eligible students "will be notified by their student's middle school." The one date the district does publish is for children new to it: a challenge-assessment qualifier is notified one week before the start of school. It is the part of this process most worth knowing about, because it is the only route that opens after the scores are already in.
Two more San Jose rules matter. A student with no spring score gets a summer window, and the district's verb is can, not must: "Students who did not take the i-Ready in the spring can take the i-Ready test during the summer between 5th-6th grade to assist with math placement." Middle schools invite the students who are missing that spring score. And the review process is narrow. Parents may ask to see the data behind a placement, and if they believe the points were added up wrong they can ask the school principal for a review. That is the whole of it. The district lists what it will not consider: the previous or current math teacher's recommendation, a parent's request, private or independent assessments from outside the district, and available space in the accelerated class.
Cupertino Union: exact cut scores, never alone
Cupertino Union publishes exact RIT cut scores, but each one sits inside a longer set of measures. The district's own page says placement "will include" multiple assessment measures, and teacher verification appears alongside the scores in every criteria table. Math 7+, the accelerated 7th grade course, takes a RIT of 235 or higher, 73.3% or higher on the spring placement assessment, and a first-semester grade of C+ or better. Algebra 1 in 7th grade takes a RIT of 250 or higher, 83.3% on the Algebra readiness test, and a B+ or better. The 8th grade rungs have their own thresholds: 240 for Algebra 1, 260 for Geometry. Miss any one measure and the RIT number does not carry you. We took Cupertino's whole system apart, the tracks, the scores, and the second path in, in a separate breakdown.
One caution about score charts you find online: these numbers move. A year earlier, Cupertino's same tables used iReady scale scores, not RIT scores. The district switched testing vendors between 2025 and 2026. A chart from last year, or from the district next door, can be flatly wrong.
Sunnyvale: a recommendation the family can overrule
Sunnyvale School District uses MAP the lightest way of the five. The district recommends Math 6 or the accelerated Math 6/7 based on two data points, the NWEA benchmark assessment and trimester 2 math grades, and its own FAQ says "the final enrollment decision rests with the student and their family." The percentiles the district names are guidance, not a gate: the 45th to 55th band near its Math 6/7 recommendation threshold, and the 95th as a guide to who might attempt its optional placement assessment, which any student may take. No numeric passing threshold is published at all.
Fairfax County: information, not a gate
Fairfax County Public Schools shows the other extreme. Its middle school honors courses have no score gate: "All seventh grade students can enroll in Math 7 Honors. There are no pre-requisites." Same for Algebra in 8th. The MAP report still matters, but as reading material. FCPS tells families to review "MAP assessment reports (RIT score, percentile, and growth)," state test history, and classroom data when deciding whether an accelerated pathway fits their child. Same test, opposite role: input for the family's decision, not a cut score for the district's.
San Mateo Union: the score follows into high school
San Mateo Union High School District shows the number does not retire after middle school. Two of its high schools, Aragon and Burlingame, run a compressed pathway that covers Geometry, Algebra 2 and Pre-Calculus in two years. The district's placement criteria, published September 2025, recommend that pathway only for students with an A in the first semester of Algebra 1, a 7th grade CAASPP score of at least 2600, and an NWEA MAP RIT score of at least 250. Read the verb: the district recommends, it does not gate. And the published values sit inside a longer entry picture, because the district's standing requirements also include its own Math Acceleration Exam and an 8th grade teacher recommendation. Once again, the RIT score is one line among several.
Not ready to do anything with the score yet?
That's fine. If one topic on the report looks shaky, Cuemath's free concept explanations walk through the why behind it, one concept at a time.
Browse Free Concept ExplanationsWhat the percentile means, and what it does not
A high percentile is a strong signal. It is usually not a placement decision. In San Jose, the 90th percentile earns 3 of the 5 points needed, now on the i-Ready Diagnostic rather than MAP. In Sunnyvale, the 95th percentile marks who might attempt an optional test. In Fairfax, no percentile opens or closes a middle school honors door, because the doors are open.
So when another parent says "you need the 95th percentile," the real question is: in which district, for which course, in which year? The percentile comes from NWEA's national norms. The rule that acts on it comes from your district, and districts revise those rules.
Timing matters too. If a fall report just came home, note that in San Jose and Cupertino, the two districts whose criteria we verified in most detail, the decision leans on spring data. San Jose uses the grade 5 spring i-Ready score for Accelerated Math 6. Cupertino combines a March placement test with NWEA scores from across the year and first-semester grades. A fall score is early information. There is a full stretch of grades and a spring test between this number and the decision.
Five questions for your school
- Which assessments feed math placement here, and is MAP one of them? In some districts it is central. In Fairfax middle school honors, it gates nothing.
- Is there a published cut score or point table? Ask for the link, and check what year it covers. San Jose and Cupertino both publish theirs. San Jose's is titled "Middle School Math Placement Criteria and Process 2026-2027" - and the year on the cover matters, because the test it scores changed between cycles.
- Which test window counts, fall or spring, and when is the decision made?
- What happens if my child misses the test or is new to the district? San Jose runs a summer i-Ready window for exactly this case.
- Is there a review or appeal, and what will it consider? In San Jose, only point-calculation errors. Outside test results are explicitly not considered.
Get that last answer in writing before you spend money on a private assessment. In at least one district we verified, it cannot enter the file.
The RIT score is a reading, not a verdict. The document that decides is your district's placement page, and that page changes: windows shift, cut scores move, vendors get swapped. Find this year's version, read it, and put its dates on your calendar. That one page is worth more than any score chart.
Where Cuemath fits
We do not set district cut scores and we cannot move a placement decision. Every district on this page decides that on its own published rules, and in San Jose an outside assessment is explicitly not considered.
What a score report often leaves unanswered is the plainer question underneath it: where is my child actually solid, and where did something break. A free Cuemath evaluation is a read on that, separate from whatever the district does with its own number.
Not sure what the number is telling you?
Start with where your child actually stands.
Book a free evaluationFor students in Grades K to 12 worldwide.
FAQs
Does a MAP RIT score decide my child's math placement?
Not by itself, in any district we verified. Districts use a test score as one measure among several: points in a matrix in San Jose, which now scores the i-Ready Diagnostic rather than the MAP RIT; RIT cut scores alongside a placement test and grades in Cupertino; guidance for a family decision in Sunnyvale and Fairfax. The rule that acts on the score is local, so your district's published placement page is the document that decides.
What is a RIT score on the MAP test?
A RIT score is the number the MAP test reports. MAP is made by NWEA. Districts use the score in two forms: some set cut scores on the RIT number itself, while others convert it into a national percentile first and act on the percentile.
What RIT score does my child need for accelerated math?
There is no national answer; each district sets its own. Cupertino Union publishes exact cut scores: 235 for Math 7+, 250 for Algebra 1 in 7th grade, 240 for Algebra 1 in 8th, and 260 for Geometry, each alongside other measures. Other districts use percentile bands or no cut score at all, and the numbers can change from one year to the next.
Is the MAP percentile compared to my child's school or class?
No. The percentile compares your child to NWEA's national norms, not to their class or school. That is why the same percentile can lead to different placements in different districts: the comparison is national, but the placement rule is local.
Do fall or spring MAP scores count more for placement?
In the districts we verified in most detail, the decision leans on spring data. San Jose uses the grade 5 spring i-Ready score for Accelerated Math 6, and Cupertino combines a March placement test with NWEA scores from across the year plus first-semester grades. A fall score is early information, not a verdict.
What happens if my child misses the MAP test?
It depends on the district, so ask directly. San Jose, for example, runs a summer i-Ready testing window between grades 5-6 and 6-7 for students who did not take the i-Ready in the spring, to assist with math placement.
Can I appeal my child's math placement?
Often yes, but the grounds can be narrow. In San Jose, parents can ask to see the data behind a placement and request a review from the school principal only if they believe the points were added up wrong. The district will not consider teacher recommendations, parent requests, or outside assessments.
Will a private assessment help my child's placement?
Ask your district in writing before paying for one. In at least one district we verified, San Jose, private or independent assessments from outside the district are explicitly not considered in placement decisions.