Star Test Scores Explained: Scaled Score and Percentile
Your child's Star Math report carries two main numbers. The scaled score sits on one scale across every grade, so it tracks the same child from one test to the next.

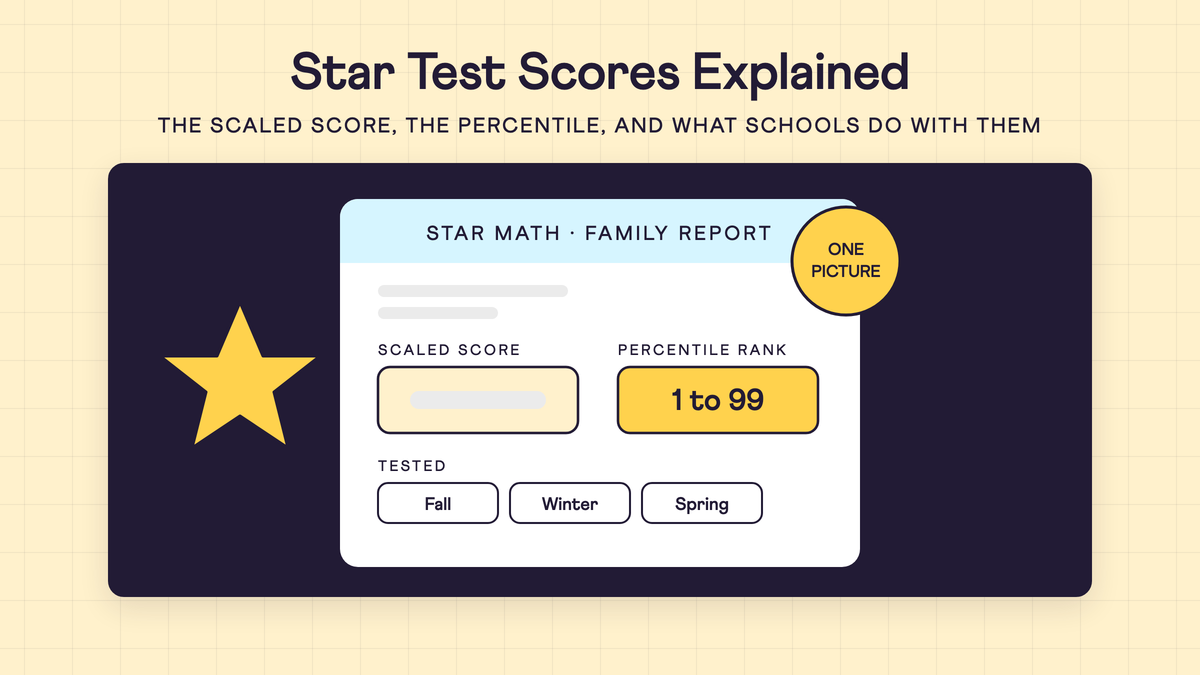
Your child's Star Math report carries two main numbers. The scaled score sits on one scale across every grade, so it tracks the same child from one test to the next. The percentile rank runs from 1 to 99 and compares your child with students in the same grade nationwide who tested at the same time of year, so it is the number for this season: a 50 means your child scored above half of them. Renaissance, the maker, says in its parent report that these scores "provide only one picture of how your child is doing in school." The maker prints no good-score line.
Does the school move a child up or down a math track on it? Only where the district writes Star into a rule, and the written rules we found differ. In Irvine Unified, Star Reading and Star Math are two of the equally weighted criteria for the APAAS application (the Alternative Program for Academically Advanced Students, grades 4 to 6, by application): the district takes the higher of the fall and winter scores, ranks the applicants, and prints no cut score. Other rules are in the table below. If your district's rule names no test, ask what it does use.
The numbers on a Star Math report
The scaled score. Irvine's 2025-26 APAAS document says Star "Scale scores range from 600 to 1400"; a 2018 Colorado description and Wisconsin's state page print 0 to 1400, an older scale. The scale has changed, so read the range off your child's own report, where the scaled score is printed beside the percentile. The maker's sample report shows a score of 805 giving a second grader "a higher score than 13% of students in second grade"; a percentile is per grade, so the same scaled score sits at a different percentile in each grade.
The percentile rank. Your child's rank among same-grade students nationwide this season. What a percentile is and is not, and why it is not a grade level, is on our 90th percentile page. An i-Ready or MAP percentile is the same kind of number, a rank against same-grade students nationally on that test's own sample, but the scores themselves do not convert between tests. Our pages on i-Ready vs MAP and i-Ready diagnostic scores read those reports, and our page on the MAP score for Algebra 1 readiness covers that one number.
The grade equivalent. Schools choose whether to print it; if your report has none, nothing is missing. The maker's example: "a first grader with a GE of 2.3 performed as well as a typical second grader after the third month of the school year", and its caveat: "The score doesn't necessarily mean that the student is capable of doing second-grade work."
The student growth percentile, if shown, runs 1 to 99 and compares your child's growth since the last test with same-grade students who started from a similar score. A rising scaled score with a flat percentile means the child grew about as much as peers did.
What schools do with a Star Math score
| Who | What the page prints | What it means for your child |
|---|---|---|
| Irvine Unified, APAAS (grades 4 to 6, by application) | Higher of the fall and winter Star Reading and Star Math scores, with the other criteria equally weighted; placement goes "to the highest scoring students in order of score" until classes fill. No Star cut score printed. | No number to clear; rank among applicants decides. |
| Irvine Unified, GATE (gifted screening, automatic, grades 3 to 5) | "students must score within the top 20% of his/her grade level" across multiple measures, Star Math fall and winter among them. | Top 20% of the grade, not a fixed Star score. A child need not be GATE-identified to apply to APAAS. |
| McLean County Unit 5, Illinois (junior high placement) | "consistent STAR Math performance at or above the 85th percentile", with the state test and teacher input; placements "are not reconsidered until after Fall Star Math data has been collected and reviewed." | One district's bar, one of several measures its page names. |
| Wisconsin Department of Public Instruction (state dashboard) | Percentile bands: 1 to 10 Urgent Intervention, 11 to 25 Intervention, 26 to 40 On Watch, 41 to 99 At/Above Benchmark. | A display for schools: the department says it "does not assign categories" for support, and the page does not say whose defaults the bands are. |
| Colorado Department of Education (2018 description) | "Districts can set performance categories based on their own cut scores". | The cut, if there is one, is the district's. |
For Irvine's APAAS, 3rd grade applicants are judged on the NNAT (a nonverbal reasoning test), Star Reading, Star Math and a writing sample; 4th and 5th grade applicants on the report card, Star and CAASPP, the state test. The winter Star test is the second score the district can take. Applications for 2027-28 open January 4, 2027, on the district's Advanced Learning page, which prints two closing dates in February, so confirm the day with the district.
Reading your child's report
- Find the season: fall, winter or spring. Compare the percentile with the same season a year ago; each season is compared with a different group of students.
- Read the percentile rank for where your child stands now, and the scaled score for the trend.
- Read the grade equivalent as a comparison, not a placement.
- Ask whether this was the main seasonal test or a short check-in between them.
- Ask for the school's written placement rule and look for percentile or scaled score in it. If no written rule names Star, ask what does.
Where Cuemath fits
Cuemath is live, one-on-one online math tutoring for grades K through 12. Its free MathFit Evaluation, a skills-and-gaps check in one live session, shows what a percentile cannot: which skills are solid and which are missing, in your child's own work. It does not change the district's rule or the Star scale.
See what sits behind the percentile
A free Cuemath MathFit Evaluation is a live, one-on-one session that shows where your child is solid and where a gap sits, in your child's own work. No credit card, and the report is yours either way.
Book a Free EvaluationFor students in Grades K to 12 worldwide.
FAQs
What is a good Star Math score?
The maker prints no good-score line. A percentile rank of 50 means your child scored above half of same-grade students nationwide who tested at the same time of year, and a 75 above three quarters of them. The printed bars are local: Unit 5's 85th percentile for acceleration, and Wisconsin's dashboard bands. Judge the number against your own district's written rule.
Are there Star Math scores by grade level?
Yes, the maker maps scaled scores to grade equivalents and percentile ranks by grade, but no public page we can quote prints the tables, and your child's report has applied them already. The percentile rank is the by-grade comparison; the grade equivalent is the by-grade reading of the scaled score.
What is Star testing in schools?
Star is Renaissance's set of computer-adaptive tests. Star Math "measures K-12 students' overall math achievement and growth" in domains including numbers and operations, algebra, geometry and measurement, and data analysis, statistics and probability. Schools give it as a screener three times a year, in fall, winter and spring, and as a progress-monitoring test as often as weekly. Star here is Renaissance Star, not a state test with a similar name.
Does the Star test decide math placement?
Only where a district writes it into its rule, and never alone in the rules we found: Irvine ranks applicants on Star with its other criteria, Unit 5 pairs the 85th percentile with the state test and teacher input, and Wisconsin's dashboard assigns nothing. Ask your school for its written rule.
Which Star tests count for APAAS in Irvine, and when is the last one before applications close?
Star Reading and Star Math, fall or winter, whichever is higher for each subject, alongside the NNAT and a writing sample in 3rd grade, or the report card and CAASPP in 4th and 5th. Applications for 2027-28 open January 4, 2027, and close in February, so the winter Star test is the last score the district can take. The district prints no Star cut score.
Is a Star percentile the same kind of number as an i-Ready or MAP percentile?
Yes: each is a rank against same-grade students nationwide, on that test's own national sample. The scores themselves do not convert between tests, and a 70th on one test is not promised to be a 70th on another.
Is Star Reading the same as Star Math?
No. They are two tests with separate scaled scores and percentiles, and a district that uses both, as Irvine does for APAAS, scores each subject on its own.