Introduction to Common Core Algebra - 1
Algebra 1 is the first of the five high-school courses (Algebra 1, Geometry, Algebra 2, Precalculus, and Calculus) and is typically taken in grade 9. However, some students take it in grade 7 or 8 so as to enable them to take Calculus or another college-level course in their senior high-school year.
The contents of Algebra 1 are divided among the following four domains:
Now, while the standards covered under the Numbers and Statistics domains are more of an extension of the corresponding grade 8 ones, those under the Equations and Functions domains introduce the student to many big mathematical ideas. Let’s take a look at some of the big ideas from these two domains and how the standards approach them.
Expressions, Equations and Inequalities
The standards in this domain recap a lot of the Algebra that is learned through middle school. However, in addition to procedural fluency, the focus here is on explaining the reasoning.
For example, the standard process of solving a linear inequality in two variables, say $$2x + 4y < 12$$ involves dividing the XY-plane into two regions using its boundary line $$2x + 4y = 12$$
Then, the region which represents the solution is identified by considering test points in both regions. However, this process is rather mechanical and the reasoning behind isn’t usually explained. So, to help the student understand this intuitively, the standards recommend building on their existing knowledge of linear equations.
To do this, we would isolate the y in $$2x + 4y < 12$$ on its LHS, and rewrite it as $$y < 3 - \frac{1}{2}x$$
Now, the boundary line is $$y = 3 - \frac{1}{2}x$$ and this helps the student understand that, for a given x-value:
To make this even clearer, the boundary line and a vertical line, say x = 4, and can be graphed as follows:

Here, when x = 4, $$3 - \frac{1}{2}x$$ equals $$3 - \frac{1}{2}(4)$$ or $$1$$
Hence, the line x = 4 intersects the boundary line at (4, 1) as shown above. Now, of the other points on the line x = 4:
Similarly, for any point (x, y) to represent a solution to $$y < 3 - \frac{1}{2}x$$ it must lie below the boundary line $$y= 3 - \frac{1}{2}x$$
Thus, we show that the region below the boundary line is the solution to the given inequality.
Functions
This domain forms the bulk of the Algebra 1 course. The standards included here formalize the student’s middle-school-understanding of functions by introducing them to the function notation and the ideas of the domain and range. This is a super-important domain on which a large chunk of more advanced high-school Math is based.
To facilitate the development of an intuitive and deep conceptual understanding of the big ideas involved here, the standards recommend the use of a variety of visual-aids as follows:
Representation: The standards recommend giving the student ample exposure to switching among different representations of a function. For example, to get a visual sense of the relationship between the input and output of a function, it is important to start with:
This is illustrated as follows:

This sort of approach helps the student appreciate the interconnectedness of different forms of representation, and understand their advantages and disadvantages. It also helps them see how a graphical representation can be useful for a qualitative comparison between two functions covering parameters like their rates of changes, increasing/decreasing intervals, etc.
Key Features of the Graph: Most textbooks treat the key features of the graph of a function, e.g. its shape, intercepts, maximum/minimum values, etc., in isolation. As a result, the student is often unable to link the algebraic and geometric interpretations of a given function. For example, consider the graph of the function f(x) = x2 - 6x +6 as follows:
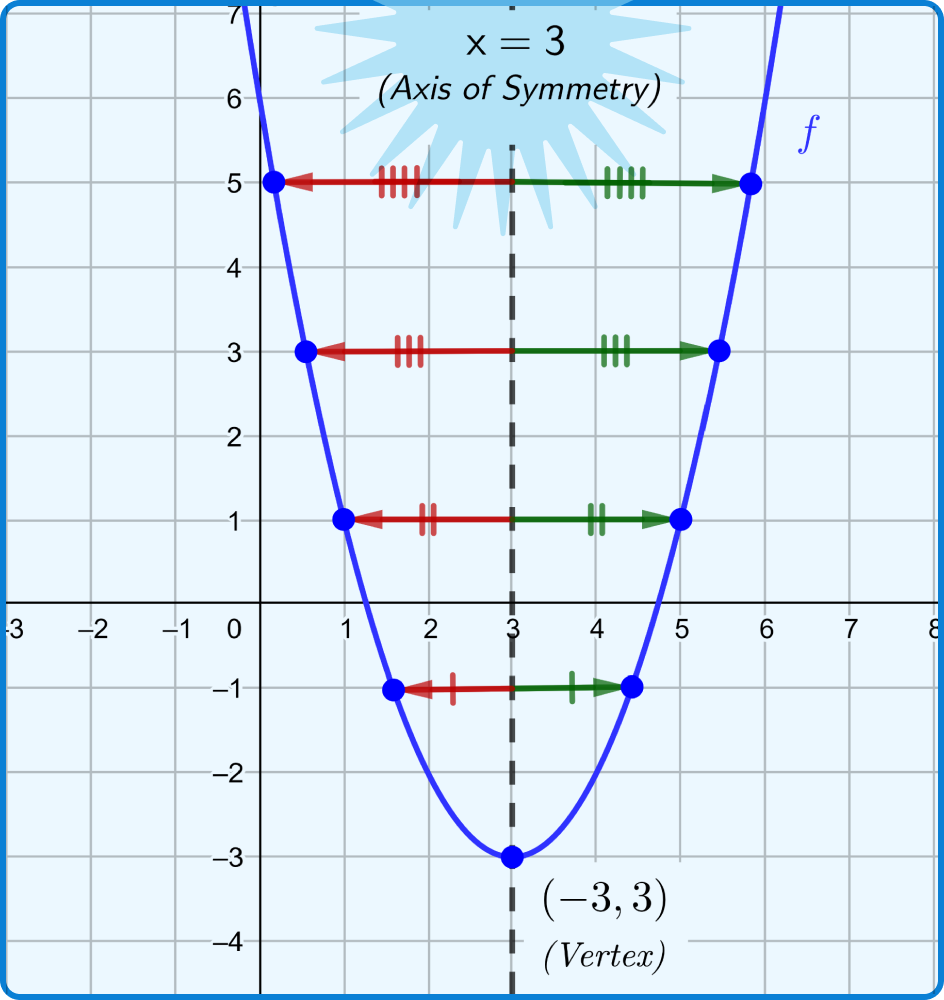
To understand why this graph is U-shaped, we can rewrite its function rule in the vertex form, i.e. f(x) = (x - 3)2 - 3. This makes it easy to recognize that:
Transformations: This is a problem-area for a lot of students as they try to commit a few formulas to memory, and then use them to solve problems. As a result, they are thrown off-guard by small changes in the way the question is worded and/or by a difference in the context. To avoid this, there is a comprehensive set of standards that are geared towards understanding the algebraic rationale behind the graphical relationships of functions like f(x) + k, kf(x), and f(kx) with f(x).
To facilitate such an understanding, using a visual-aid like the one shown below can be helpful:

As shown above, getting the students to compare the outputs of functions f(x) and g(x) = f(x) + k for a few random x-values makes it evident the value of g(x) is k units more than that of the corresponding value of f(x). Hence, the point associated with a given x-value on the graph of g is k units above the corresponding point on the graph of f. And therefore, the graph of g is the same as the graph of f shifted vertically upwards by k units.
The Cuemath curriculum provides learning experiences of important concepts through concrete and pictorial representations and connects mathematics with the lives of students. Cuemath conducts Live Online Math classes. This makes the students love math and see its relevance in their day to day lives.
-By Rigved Jhunjhunwala
visual curriculum