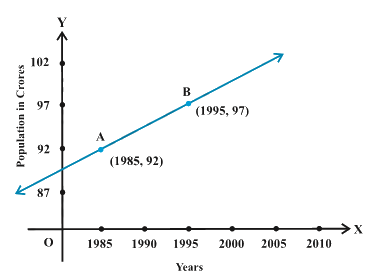
Consider the following population and year graph (Fig 10.10), find the slope of the line AB and using it, find what will be the population in the year 2010?
Solution:
Since line AB passes through points A(1985, 92) and B (1995, 97), its slope is
(97 - 92)/(1995 - 1985) = 5/10 = 1/2
Let y be the population in the year 2010.
Then, according to the given graph, line AB must pass through point C (2010, y).
Therefore, Slope of AB = Slope of BC
1/2 = (y - 97)/(2010 - 1995)
1/2 = (y - 97)/15
15/2 = (y - 97)
y = 7.5 + 97
y = 104.5
Thus, the slope of line AB is 1/2, while in the year 2010, the population will be 104.5 crores
NCERT Solutions Class 11 Maths Chapter 10 Exercise 10.1 Question 14
Consider the following population and year graph (Fig 10.10), find the slope of the line AB and using it, find what will be the population in the year 2010?
Summary:
Considering the given population and year graph (Fig 10.10), the slope of the line AB is 1/2 and using it, the population in the year 2010 is 104.5 crores
Math worksheets and
visual curriculum
visual curriculum