visual curriculum
Table of Contents
| 1. | What is a Venn Diagram? |
| 2. | Practice Problems |
| 3. | Conclusion |
| 4. | Frequently Asked Questions (FAQs) |
| 5. | External References |
11 January 2021
Reading Time: 4 Minutes
What is a Venn Diagram?
A Venn diagram is a diagram that shows the relationship between and among a finite collection of sets.
If we have two or more sets, we can use a Venn diagram to show the logical relationship among these sets as well as the cardinality of those sets. In particular, Venn Diagrams are used to demonstrate De Morgan's Laws.
Venn diagrams are also useful in illustrating relationships in statistics, probability, logic, and more. Venn diagrams are particularly useful in helping us think carefully about set operations as they give us a visual depiction of the relationships involved.
Also read
Logical Venn Diagrams
A Venn diagram is a diagram that shows the relationship between and among a finite collection of sets. If we have two or more sets, we can use a Venn diagram to show the logical relationship among these sets as well as the cardinality of those sets. In particular, Venn Diagrams are used to demonstrate De Morgan's Laws.
Logical Venn Diagrams are mentioned below in the Downloadable PDF.
| 📥 | Logical Venn Diagrams |
Let us understand this through few examples
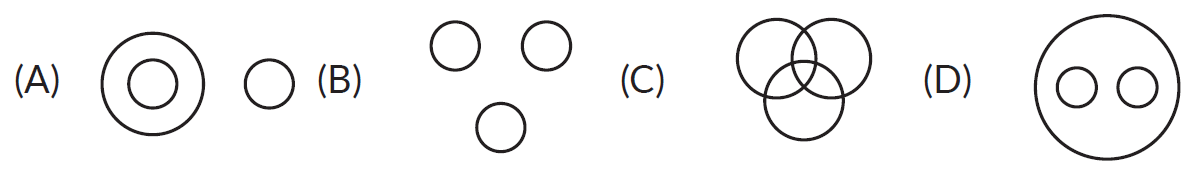
Example 1: Which of the following Venn diagrams best represent the relationship among "Actors, Producers, Directors"?
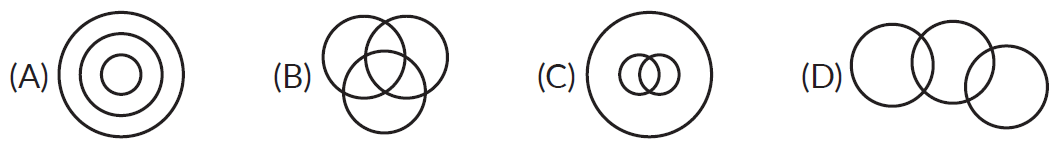
Answer: Some actors may be producers. Some producers may be directors. Some directors are Actors. Correct answer is option (B)
| (B) |
Example 2: Which of the following Venn diagrams correctly describes the relationship amongst "Clothes, Flowers and Bright things"?
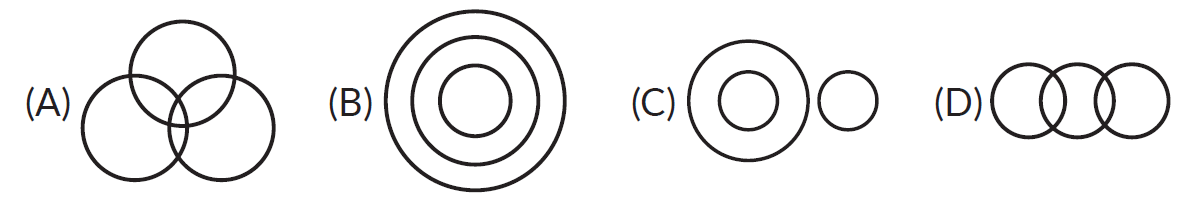
Answers: Clothes and flowers are bright things. According to their colors. Correct answer is option (D).
| (D) |
Example 3: In the figure, rectangle, square, circle, and triangle represent the regions of wheat, gram, maize, and rice cultivation respectively. On the basis of the figure, answer the following questions.
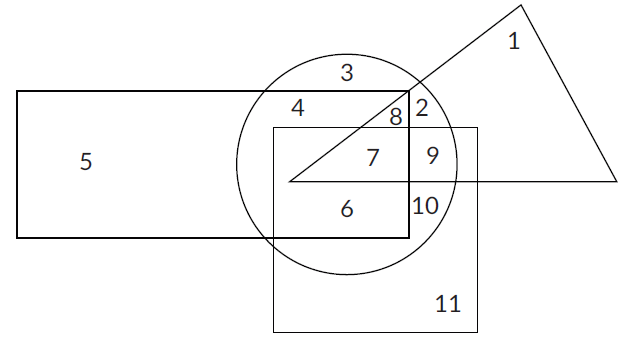
In which area are all 4 crops cultivated?
(A) 7 (B) 8 (C) 9 (D) 2
Answers: It is because 7 is the only point where all the shapes meet. So it's the exact place where all the crops are cultivated. Correct answer is option (A)
| (A) 7 |
Practice Problems on Venn Diagrams
Question 1: Select the correct alternative from the given choices. Which of the following indicates the best relation between the given words?
"Profit, Dividend, Bonus"
Question 2: Select the correct alternative from the given choices: Which of the following indicates the best relation between the given words?
"Teachers, Parents, Guardians"
Question 3: In the following figure, the circle represents all the people who prefer Pepsi, the square represents all the people who prefer Coke, the triangle represents all the people who prefer Limca and the rectangle represents all the people who prefer Dew.
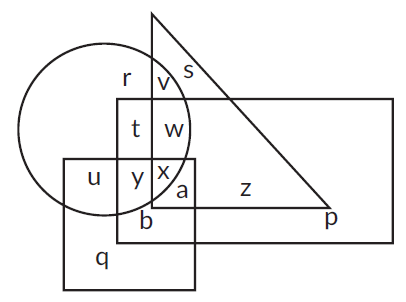
Which letter represents the people who prefer only Dew and Coke?
(A) r (B) u (C) b (D) q
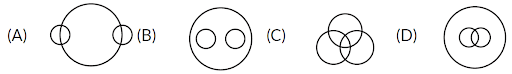
Question 4: Which of the following options best represents the given Venn diagram?
(A) Males, Females, Teacher
(B) Tomato, Potato, Apple
(C) Vegetable, Grass, Bottle gourd
(D) Painter, Crow, Hen
Answers
| 1. (A) 2. (C) 3. (C) 4. (C) |
Conclusion
Venn diagrams are used to determine the validity of particular arguments and conclusions. In deductive reasoning, if the premises are true and the argument form is correct, then the conclusion must be true.
I hope you got a better understanding regarding venn diagrams. It enables children to visualize concepts and thus understand math concepts better and faster.
These diagrams help the children to build interest in math and make them explore numerous activities like these. Discovering math with these exercises will help them to lessen the antagonism created with the subject.
Best of luck!!!
-Written by Prema Jyothi, Cuemath Teacher
Frequently Asked Questions (FAQs)
What are the parts of a Venn Diagram?
A Venn diagram consists of multiple overlapping closed curves, usually circles, each representing a set.
How is Venn Diagrams useful?
Venn diagrams enable students to organise information visually so they are able to see the relationships between two or three sets of items. They can then identify similarities and differences.