Solve the following system of the inequalities graphically: x + y ≤ 9, y > x, x ≥ 0
Solution:
x + y ≤ 9 ....(1)
y > x ....(2)
x ≥ 0 ....(3)
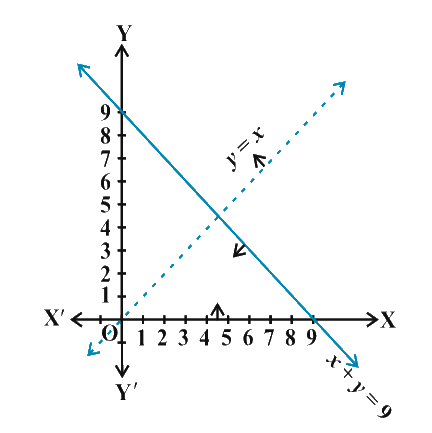
The graph of the lines, x + y = 9 and y = x are drawn in the figure below.
Inequality x + y ≤ 9 represents the region below the line, x + y = 9 (including the line x + y = 9)
It is observed that:
(0, 1) satisfies the inequality, y = x . Since, 1 > 0 .
Therefore, inequality y > x represents the half plane, corresponding to the line, y = x, containing the point (0, 1), (excluding the line y = x).
Inequality x ≥ 0 represents the region on the right-hand side of the line, x = 0 or y-axis (including the y-axis).
Hence, the solution of the given system of linear inequalities is represented by the common shaded region including the points on the lines, x + y = 9 and x = 0, but excluding the points on line y = x as follows:
NCERT Solutions Class 11 Maths Chapter 6 Exercise 6.3 Question 8
Solve the following system of the inequalities graphically: x + y ≤ 9, y > x, x ≥ 0
Summary:
Linear inequations x + y ≤ 9, y > x, x ≥ 0 is given. We have found that the solution of the given system of linear inequalities is represented by the common shaded region including the points on the lines, x + y = 9 and x = 0, but excluding the points on line y = x
visual curriculum