Graphs of Quadratic Expressions - Theory
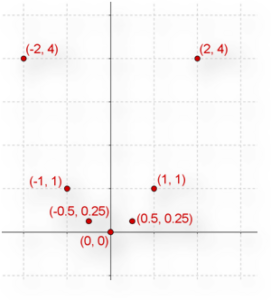
Consider the quadratic expression \(Q\left( x \right)\,\,:\,\,{x^2}\). As the value of \(x\) will vary, the value of \(Q\) will vary. Below, the value of \(Q\) has been calculated for some values of \(x\):
|
\[x = \] |
\[0\] |
\[1\] |
\[ - 1\] |
\[2\] |
\[ - 2\] |
\[\frac{1}{2}\] |
\[ - \frac{1}{2}\] |
|
\[Q\left( x \right) = \] |
\[0\] |
\[1\] |
\[1\] |
\[4\] |
\[4\] |
\[\frac{1}{4}\] |
\[\frac{1}{4}\] |
A very powerful way to visualize the variation of an expression’s value with the variable’s value is through graphing. For example, in the example above, we can plot \(x\) on the horizontal scale and \(Q\left( x \right)\,\,:\,\,{x^2}\) on the vertical scale. Let us plot the seven points we have obtained above:
We plotted only seven points, but theoretically, we can calculate the value of \(Q\) for every (real) value of \(x\). If we were to plot all those points, we would obtain a continuous curve:
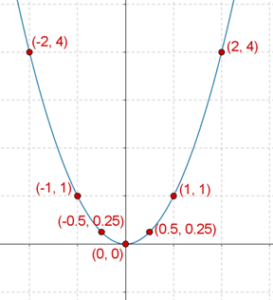
This curve is an example of a parabola, which opens upward. Note that the minimum value of the expression is obtained when \(x = 0\):
\[{Q_{\min }} = Q\left( {x = 0} \right) = {0^2} = 0\]
In the statement above, \({Q_{\min }}\) stands for the minimum value of \(Q\), while \(Q\left( {x = 0} \right)\) is to be read as “the value of \(Q\) when \(x = 0\)”
Next, consider the expression \(Q\left( x \right)\,\,:\,\, - {x^2}\). Let us again calculate the values of \(Q\) for some values of \(x\):
|
\[x = \] |
\[0\] |
\[1\] |
\[ - 1\] |
\[2\] |
\[ - 2\] |
\[\frac{1}{2}\] |
\[ - \frac{1}{2}\] |
|
\[Q\left( x \right) = \] |
\[0\] |
\[ - 1\] |
\[ - 1\] |
\[ - 4\] |
\[ - 4\] |
\[ - \frac{1}{4}\] |
\[ - \frac{1}{4}\] |
Let us plot the graph of \(Q\left( x \right)\) versus \(x\), using these seven points as our guiding points:
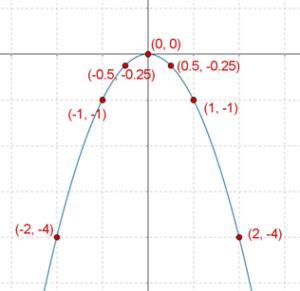
We have again obtained a parabola, but in this case, the parabola opens downward. Also, we note that
\[{Q_{\max }} = Q\left( {x = 0} \right) = - {0^2} = 0\]
The graph of any quadratic expression will be a parabola.
Being able to quickly plot the graph of a quadratic expression is a very useful skill. Therefore, we urge you to practice this skill as much as you can. The steps involved in plotting a quadratic’s graph are outlined below:
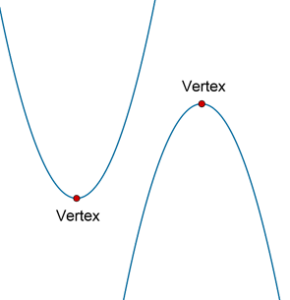
Step-1: Let the quadratic expression be \(Q\left( x \right)\,\,:\,\,a{x^2} + bx + c\). Check the sign of the coefficient of \({x^2}\), that is, the sign of \(a\).
-
If \(a > 0\), the parabola will open upward
-
If \(a < 0\), the parabola will open downward.
Step-2: Using factorization or the quadratic formula, calculate the zeroes of the expression. These are the two points where the parabola will cut the horizontal axis. If the roots come out to be non-real, then the parabola will not cut the horizontal axis.
Step-3: Calculate the coordinates of the vertex of the parabola. For an upward opening parabola, the vertex is the bottommost point, while for a downward opening parabola, the vertex is the topmost point:
The coordinates of the vertex are \(V \equiv \left( { - \frac{b}{{2a}}, - \frac{D}{{4a}}} \right)\), where D is the discriminant, given by \(D = {b^2} - 4ac\). Later on, you will understand the reason behind this expression for the vertex’s coordinates.
Step-4: To make your graph more accurate, calculate the value of the expression at a couple of specific values of x.
Let us apply this sequence of steps to a few Graphs of Quadratic Expressions - Examples.