Introduction to Graphing
In this section, we will understand the graphical significance of a two-variable linear equation. Consider the equation \(x + 2y = 4\). Let us write down a few specific solutions of this equation:
| \(x=\) | \(0\) | \(1\) | \(2\) | \(3\) | \(4\) |
| \(y=\) | \(2\) | \(\frac{3}{2}\) | \(1\) | \(\frac{1}{2}\) | \(0\) |
| \(sol\) | \(\left( {0,2}\right)\) | \(\left({1,\frac{3}{2}} \right)\) | \(\left( {2,1}\right)\) | \(\left({3,\frac{1}{2}} \right)\) | \(\left( {4,0}\right)\) |
Let us plot these five solutions (points) on a coordinate plane:
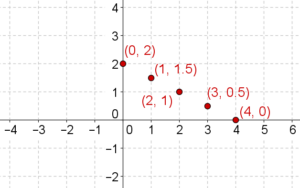
These five points seem to be collinear, that is, they seem to lie on a straight line. In fact, they are collinear! And not just these five points: if you take any other solution of this equation, it will also lie on the same straight line:
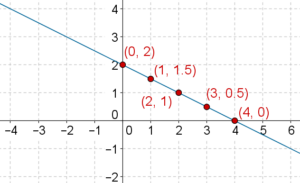
And, every point on this particular straight line will satisfy this particular linear equation. Note: when we say that a point satisfies a linear equation or a point is a solution of a linear equation, what we mean to say is that the coordinates of the point satisfy the linear equation.
Let us summarize: any two-variable linear equation (say E) graphically corresponds to a straight line (say L) in the coordinate plane. Every solution of E lies on L, and every point on L is a solution of E. Any point not on L is not a solution of E.
In a higher class, you will clearly understand why the graph of a linear equation is a straight line. For now, just observe the fact that the word linear comes from the word line. Since any equation of the \(ax + by + c = 0\) graphically corresponds to a straight line, that is why it is called a linear equation.
To uniquely plot a line, we need only two points lying on it. Thus, to plot the graph of a linear equation, we need to plot only two distinct solutions of the equation. And then, because we know that the graph of a linear equation is a straight line, we can simply draw the line through these two points to obtain the graph of the equation.
Let us apply this to a few examples.
Example 1: Plot the graph of the linear equation \(x - 4y + 3 = 0\).
Solution: We determine any two solutions of this equation:
| \(x = \) |
\(1\) |
\( - 1\) |
|
\(y = \) |
\(1\) |
\(\frac{1}{2}\) |
|
\(sol\) |
\(\left( {1,1}\right)\) |
\(\left( { -1,\frac{1}{2}} \right)\) |
We plot these two solutions, and then draw the line through them to obtain the graph of the given equation:
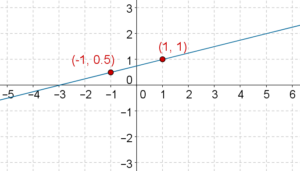
Let us assure ourselves that this is indeed the graph of \(x - 4y + 3 = 0\). For that purpose, we have picked three points on this line other than the two solutions we used to plot the line:
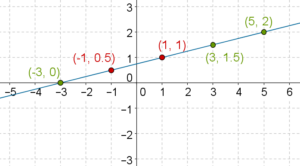
You may verify that these three points are also solutions of \(x - 4y + 3 = 0\). In fact, if you take any other point whatsoever on this line, it will be a solution of \(x - 4y + 3 = 0\). And, any point not on this line will not be a solution of \(x - 4y + 3 = 0\). You should proceed further only when you are absolutely clear about this discussion.
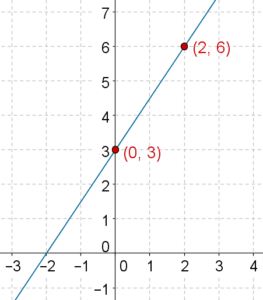
Example 2: Plot the graph of \( - \frac{1}{2}x + \frac{1}{3}y = 1\).
Solution: We determine any two specific solutions of the equation:
|
\[x = \] |
\(2\) |
\(0\) |
|
\[y = \] |
\(6\) |
\(3\) |
|
Sol |
\[\left( {2,6}\right)\] |
\[\left( {0,3}\right)\] |
The graph of the equation is plotted below:
Example 3: The graph of a linear equation is presented below:
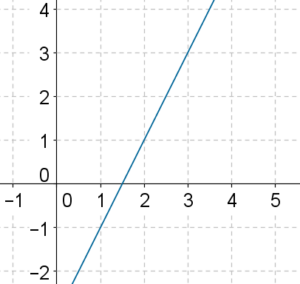
Which of the following equations does it represent?
(A) \(x - 2y + 4 = 0\)
(B) \(2x + y - 3 = 0\)
(C) \(x + 2y + 1 = 0\)
(D) \(2x - y - 3 = 0\)
Solution: We take any two points on the graph, and determine that equation which both these points satisfy:
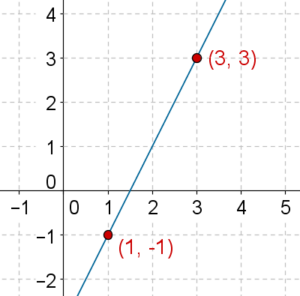
Now, it is easy to verify that among the given options, the only equation which both these points P and Q satisfy is \(2x - y - 3 = 0\). Thus, the correct option is (D).
Example 4: In the figure below, three equations are specified, and three lines are drawn. By inspection, determine which equation corresponds to which line.
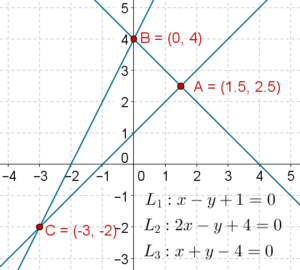
Solution: By inspection, you may note that
- \(A,\,B\) satisfy \({L_3}\)
- \(B,\,C\) satisfy \({L_2}\)
- \(C,\,A\) satisfy \({L_1}\)