Solve the following system of inequality graphically: x ≥ 3, y ≥ 2
Solution:
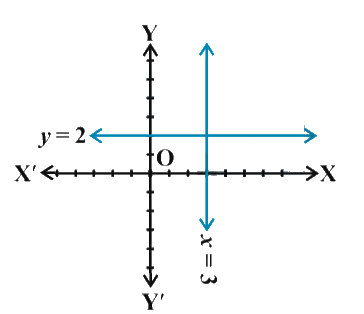
x ≥ 3 ....(1)
y ≥ 2 ....(2)
The graph of the lines, x = 2 and y = 2 are drawn in the figure below
Inequality x ≥ 3 represents the region on the right-hand side of the line, x = 2 (including the line the line x = 2),
and inequality y ≥ 2 represents the region above the line, y = 2 (including y = 2).
Hence, the solution of the given system of linear inequalities is represented by the common shaded region including the points on the respective lines as follow:
NCERT Solutions Class 11 Maths Chapter 6 Exercise 6.3 Question 1
Solve the following system of inequality graphically: x ≥ 3, y ≥ 2
Summary:
Linear inequations x ≥ 3, y ≥ 2 is given. We have found that the solution of the given system of linear inequalities is represented by the common shaded region including the points on the respective lines
Math worksheets and
visual curriculum
visual curriculum