How to calculate Correlation Coefficient
The word "correlation" is made by clubbing the words "co" and "relation". The word "co" means together, thus, correlation means the relationship between any set of data when considered together.
In Statistics, the correlation coefficient is a measure defined between the numbers -1 and +1 and represents the linear interdependence of the set of data.
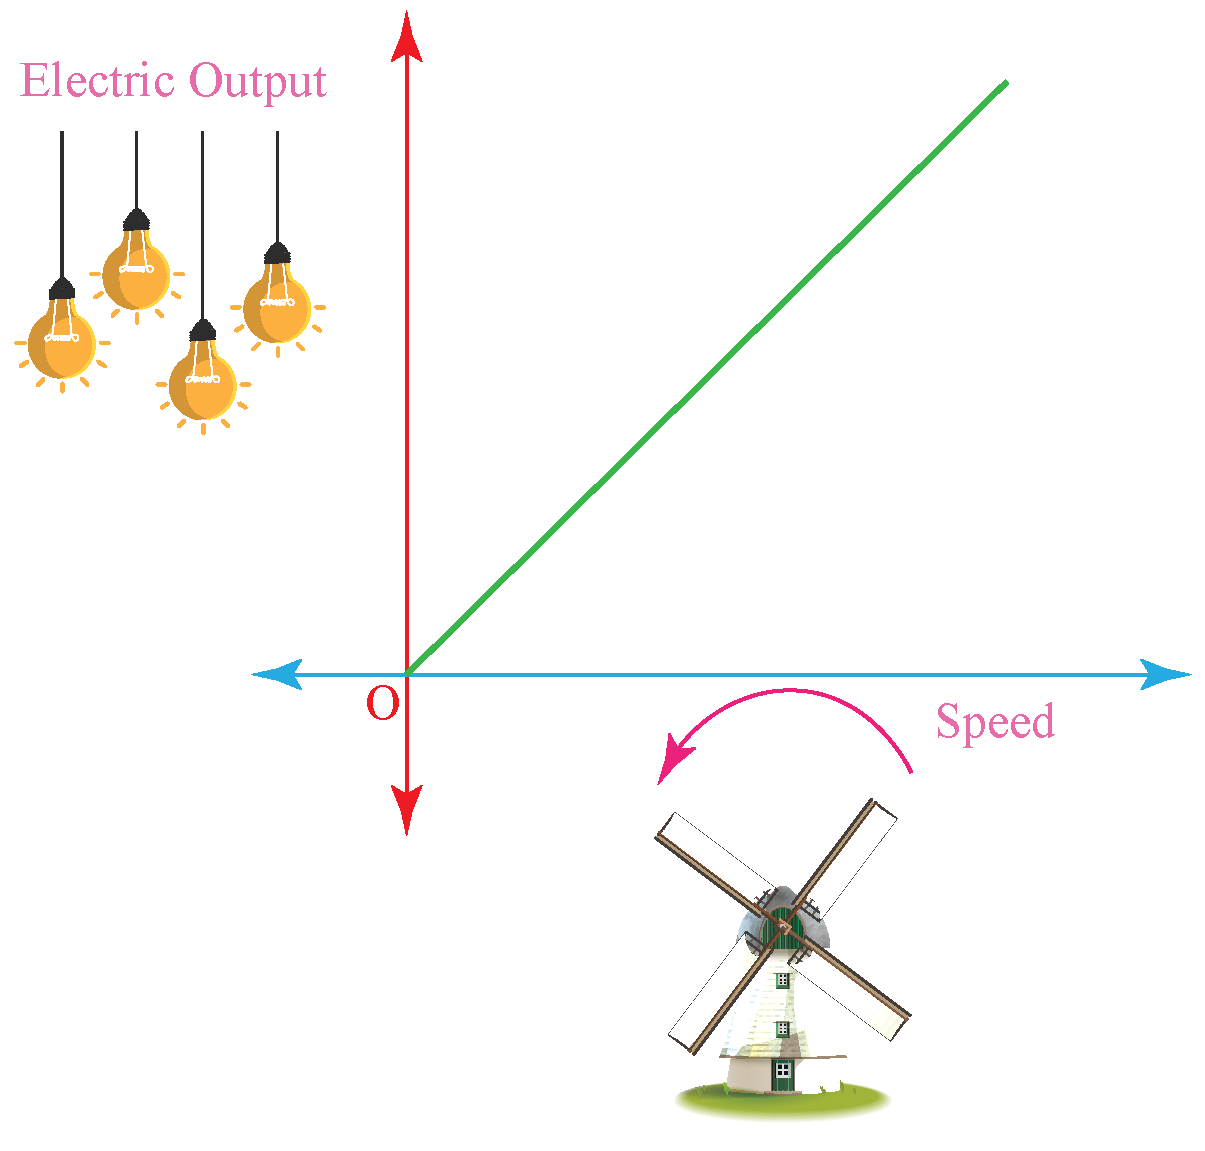
Let us analyze the following situation:
For electricity generation using a windmill, if the speed of the wind turbine increases, the generation output will increase accordingly. Thus, the variable speed and electricity output have a positive correlation here.
This correlation can be studied using the correlation coefficient.
In this mini-lesson, we will study the correlation coefficient definition and the correlation coefficient formula.
Check out the interactive examples on correlation coefficient formula, along with practice questions at the end of the page.
Lesson Plan
What Is Correlation Coefficient?
Correlation Coefficient Definition
The correlation coefficient is used to measure the strength of the relationship between two variables.
The value of the correlation coefficient ranges from -1.0 to +1.0
This means that any value beyond this range will be the result of an error in correlation measurement.
A correlation of value -1.0 means a perfect negative correlation, while a correlation of +1.0 means a perfect positive correlation.
A correlation of 0.0 means no linear relationship between the movement of the two variables.
Correlation Coefficient Example
The following correlation graphs show the examples of different range of values for a correlation coefficient:

There are several types of correlation coefficients, Pearson's correlation (r) being the most common among all.
It measures the strength and direction of the linear relationship between the two variables and cannot capture nonlinear relationships between two variables.
It cannot differentiate between dependent and independent variables.
How to Calculate Correlation Coefficient?
- The correlation coefficient can be calculated by first determining the covariance of the given variables.
- This value is then divided by the product of standard deviations for these variables.
- The equation given below summarizes the above concept:
\( \rho_{xy} = \frac { \text{Cov} ( x, y ) }{ \sigma_x \sigma_y } \)
where,
\[ \rho_{xy} = \text{Pearson's product-moment correlation coefficient} \\ \text{Cov}(x, y) = \text{covariance of variables} \,\, x \text{ and } y \\ \sigma_x = \text{standard deviation of } x \\ \sigma_y = \text{standard deviation of } y \]
Covariance
Covariance gives the joint relationship between two random variables.
It is calculated using the following formula:
\( Cov(X,Y) = \dfrac{\Sigma(X_i - \overline{X})(Y_i - \overline{Y})}{n}\)
where,
\( \begin{align*} X, Y &= \text{random variables} \\ X_i &= \text{data value of x} \\ Y_i &= \text{data value of y} \\ \overline{X} &= \text{mean of all values of} \,\, X \\ \overline{Y} &= \text{mean of all values of } Y \\ n &= \text{Total number of values of X or Y} \end{align*}\)
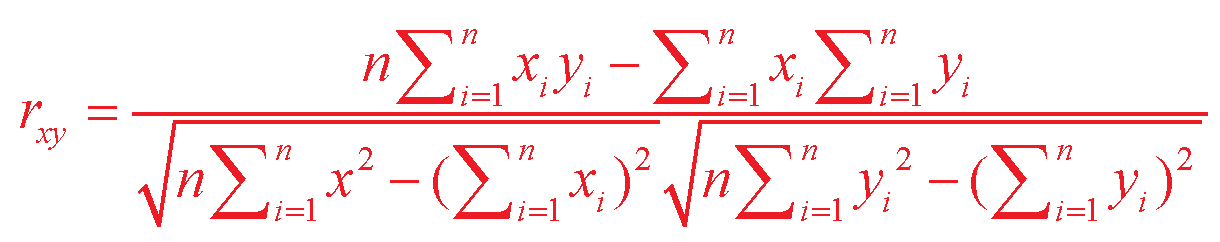
Formula of Correlation Coefficient
The formula for correlation coefficient is given as:
\( r = \dfrac{n(\Sigma xy) - (\Sigma x)(\Sigma y) }{\sqrt{[n \Sigma x^2 - (\Sigma x)^2][n\Sigma y^2 - (\Sigma y)^2]}} \)
where,
\( \begin{align*} n &= \text{Quantity of information} \\ \Sigma x &= \text{Total of all values for first variable} \\ \Sigma y &= \text{Total of all values for second variable} \\ \Sigma xy &= \text{Sum of product of first and second value} \\ \Sigma x^2 &= \text{Sum of squares of the first value} \\ \Sigma y^2 &= \text{Sum of squares of the second value} \end{align*}\)
| \( r = \dfrac{n(\Sigma xy) - (\Sigma x)(\Sigma y) }{\sqrt{[n \Sigma x^2 - (\Sigma x)^2][n\Sigma y^2 - (\Sigma y)^2]}}\) |

- The value of the correlation coefficient ranges from -1.0 to +1.0.
- Correlation is symmetric for both variables, say \(x, y\).
- For a positive correlation: the values increase together.
- For a negative correlation: one value decreases as the other increases.
Types of Correlation Coefficient Formulas
There are different correlation formulas available for the calculation of coefficient formulas:
Pearson’s Correlation Coefficient Formula
\( r = \frac{ n(\Sigma xy) - (\Sigma x)(\Sigma y) }{\sqrt{[n \Sigma x^2 - (\Sigma x)^2][n\Sigma y^2 - (\Sigma y)^2]}}\)
where,
\( \begin{align*} n &= \text{Quantity of information} \\ \Sigma x &= \text{Total of all values for first variable} \\ \Sigma y &= \text{Total of all values for second variable} \\ \Sigma xy &= \text{Sum of product of first and second value} \\ \Sigma x^2 &= \text{Sum of squares of the first value} \\ \Sigma y^2 &= \text{Sum of squares of the second value} \end{align*}\)
Linear Correlation Coefficient Formula
where the symbols for variables have their general meaning.
Sample Correlation Coefficient Formula
\( r_{xy} = \dfrac{S_{xy}}{S_x \ S_y} \)
where,
\( \begin{align*} S_x , S_y &= \text{Standard deviations} \\ S_{xy} &= \text{ Sample covariance} \end{align*} \)
Population Correlation Coefficient Formula
\( \rho_{xy} = \dfrac{\sigma_{xy}}{\sigma_x \sigma_y} \)
where,
\(\begin{align*} \sigma_x , \sigma_y &= \text{Population standard deviations} \\ \sigma_{xy} &= \text{Population covariance} \end{align*}\)
What is the difference between Correlation and Regression?
| Correlation | Regression |
|---|---|
| This indicates the nature and the extent of the linear relationship. | This studies the impact of the independent variable on the dependent variable. |
| The variables are positively or negatively correlated if the correlation is a positive or negative value respectively. |
For a positive regression coefficient: For every unit increase in \(x\), there is a corresponding average increase in \(y\) in \( b_{YX}\). For a negative regression coefficient: For every unit increase in \(x\), there is a corresponding average decrease in \(y\) in \( b_{YX} \). |
| It is symmetric for both variables, say \(x, y\). | It is not symmetric for both variables, say for variables \(x\) and \(y\), \(b_{XY}\) and \(b_YX \) have different interpretations and meaning. |

- How can you prove the symmetricity of correlation and non-symmetricity for covariance?
Solved Examples
| Example 1 |
Can you help Jake calculate the correlation coefficient for the following data?
\(X\) = 4, 8 ,12, 16 and
\(Y\) = 7, 14, 21, 28
Solution
Given variables are:
X = 4, 8 ,12, 16
Y = 7, 14, 21, 28
To find the linear coefficient of this data, we will first construct a table to get the required values of the formula:
| \(X\) | \(Y\) | \(X^2\) | \(Y^2\) | \(XY\) |
|---|---|---|---|---|
| 4 | 7 | 16 | 49 | 28 |
| 8 | 14 | 64 | 196 | 112 |
| 12 | 21 | 144 | 441 | 252 |
| 16 | 28 | 256 | 784 | 448 |
| \(\sigma{X} = 40\) | \(\sigma{Y} = 70\) | \(\sigma{X^2} = 480\) | \(\sigma{Y^2} = 1,470\) | \(\sigma{XY} = 840\) |
We know,
\( r = \frac{ n(\Sigma xy) - (\Sigma x)(\Sigma y) }{\sqrt{[n \Sigma x^2 - (\Sigma x)^2][n\Sigma y^2 - (\Sigma y)^2]}}\)
Putting all values, we get:
\( \begin{align*} r &= \frac{ 4\times 840 - (40)(70) }{\sqrt{[4 \times 480 - (40)^2][4 \times 1,470 - (70)^2]}} \\ &= \frac{3,360 - 2,800}{ \sqrt{[1,920 - 1,600][5,880 - 4,900]}} \\ &= \frac{560}{560} \\ &= 1 \end{align*}\)
Hence, the Correlation coefficient:
r = 1
| \(\therefore\) Correlation coefficient, r = 1 |
| Example 2 |
What is the difference between covariance and correlation for any given variables?
Solution
The difference between covariance and correlation can be studied using the following table:
| Correlation | Covariance |
|---|---|
| Correlation is the measure to indicate the strength of the relationship between two variables. | Covariance is the measure to indicate the extent up to which two variables can change. |
| It is the scaled form of correlation. |
It is a measure of correlation. |
| It lies between -1 to +1. | It lies between \( -\infty\) to \(+ \infty\). |
| Change in scale does not affect correlation. | Change in scale affects the value of covariance. |
Interactive Questions
Here are a few activities for you to practice. Select/Type your answer and click the "Check Answer" button to see the result.
Let's Summarize
The mini-lesson targeted the fascinating concept of the correlation coefficient. The math journey around correlation coefficient started with what a student already knew and went on to creatively crafting a fresh concept in the young minds. Done in a way that not only it is relatable and easy to grasp, but also will stay with them forever.
About Cuemath
At Cuemath, our team of math experts is dedicated to making learning fun for our favorite readers, the students!
Through an interactive and engaging learning-teaching-learning approach, the teachers explore all angles of a topic.
Be it worksheets, online classes, doubt sessions, or any other form of relation, it’s the logical thinking and smart learning approach that we, at Cuemath, believe in.
FAQs on Correlation Coefficient
1.What is Pearson's Correlation?
Pearson's correlation is the measure of strength between any two variables. It is determined using the Pearson's correlation coefficient, whose values lie between -1 and +1
The formula to calculate Pearson's correlation coefficient is given by:
\( r = \frac{ n(\Sigma xy) - (\Sigma x)(\Sigma y) }{\sqrt{[n \Sigma x^2 - (\Sigma x)^2][n\Sigma y^2 - (\Sigma y)^2]}}\)
where,
\( \begin{align*} n &= \text{Quantity of information} \\ \Sigma x &= \text{Total of all values for first variable} \\ \Sigma y &= \text{Total of all values for second variable} \\ \Sigma xy &= \text{Sum of product of first and second value} \\ \Sigma x^2 &= \text{Sum of the squares of the first value} \\ \Sigma y^2 &= \text{Sum of squares of the second value} \end{align*}\)
2.What are the potential problems with Pearson's Correlation?
Pearson's correlation can be used to measure the strength between any two variables. It is determined using the Pearson's correlation coefficient, whose values lie between -1 and +1
3.How to find Pearson’s Correlation Coefficients?
The formula to calculate Pearson's correlation coefficient is given by:
\( r = \frac{ n(\Sigma xy) - (\Sigma x)(\Sigma y) }{\sqrt{[n \Sigma x^2 - (\Sigma x)^2][n\Sigma y^2 - (\Sigma y)^2]}}\)
where,
\( \begin{align*} n &= \text{Quantity of information} \\ \Sigma x &= \text{Total of all values for first variable} \\ \Sigma y &= \text{Total of all values for second variable} \\ \Sigma xy &= \text{Sum of product of first and second value} \\ \Sigma x^2 &= \text{Sum of squares of the first value} \\ \Sigma y^2 &= \text{Sum of squares of the second value} \end{align*}\)
4.What is the Linear Correlation Coefficient?
Linear Correlation Coefficient is the measure of strength between any two variables. It is determined using the Pearson's correlation coefficient, whose values lie between -1 and +1
The formula to calculate Linear Correlation Coefficient is given by:
- Live one on one classroom and doubt clearing
- Practice worksheets in and after class for conceptual clarity
- Personalized curriculum to keep up with school