Probability and Statistics
Rosie and her family were watching a football match. She was curious to know about the winner of the match. She asked her dad and he told her that there is a probability for team A to win. Rosie wanted to know what the word "probability" meant.
Her dad explained that for any event there is an outcome. These outcomes are known as probability.
Rosie then wanted to know how many matches have team A won so far and what is the maximum number of goals put by them. Her dad told her that they need to check the statistics report of team A. He further added that statistics is a branch of math that deals with the collection, analysis, interpretation, and presentation of data.

Lesson Plan
What Is Probability and Statistics?
Probability is a concept used in math and science to know the likelihood or occurrence of an event. For example, when a coin is tossed, there is a probability to get a head or tail.
Statistics deals with a set of data. Sometimes we may be interested in finding the most favorite or frequently used item from a set of data.
In such cases, we can work on the data set to make an analysis and conclusion.
This concept that deals with data analysis, interpretation, and presentation of data in a more meaningful way is statistics.
We will discuss the probability and statistics formula in the sections below to find out the values for various real-world situations.
What Are the Three Types of Probability?
- Theoretical or Classical Probability
- Experimental Probability
- Axiomatic Probability
Theoretical or Classical Probability
Theoretical probabilty measures the favorable outcome of an event.
\(\begin{align}P(Event)\: =\: \frac{Total \:number\: of \:favorable\: outcome\: of\: an\: event\:}{Total\: number\: of\: outcomes} \end{align}\)
For example, when we toss a coin, we get a head or a tail.
\(\begin{align}P(Head)\: =\: \frac{1}{2} \end{align}\)
\(\begin{align}P(Tail)\: =\: \frac{1}{2} \end{align}\)
Experimental Probability
Experimental probability measures the total number of favorable outcomes for the number of times an experiment is repeated.
\(\begin{align}P(Event)\: =\: \frac{Total \:number\: of \:favorable\: outcomes\: of\: an\: event}{Total\: number\: of\: times\: the\: experiment\: is\: made} \end{align}\)
For example, if a coin is tossed 8 times, and heads occurs for 3 times, then
\(\begin{align}P(Head)\: =\: \frac{3}{8} \end{align}\)
\(\begin{align}P(Tail)\: =\: \frac{5}{8} \end{align}\)
Axiomatic Probability
Axiomatic probability is one more way to describe the outcomes of an event.
There are three rules or axioms which apply to all types of probability.
These rules were defined by Kolmogorov and is called Kolmogorov's axioms.
The three axioms are as follows:
- For any event, the probability is greater than or equal to 0.
- Sample space defines the set of all possible outcomes of an event.
- If A and B are two mutually exclusive outcomes (two events that cannot occur at the same time) then the probability of A or B occurring is a probability of A plus the probability of B.
What Are the Five Rules of Probability?
- The probability of an impossible event is phi or a null set.
- The maximum probability of an event is its sample space (sample space is the total number of possible outcomes).
- The probability of any event exists between 0 and 1. 0 can also be a probability.
- There cannot be a negative probability for an event.
- If A and B are two mutually exclusive outcomes (two events that cannot occur at the same time) then the probability of A or B occurring is the probability of A plus the probability of B.
Scroll down to find some probability and statistics formulas.
What Is the Formula to Calculate Probability?
Any event that happens has an outcome. There may be so many outcomes for an event.
The formula to calculate probability is as follows.
Let P(X) denote the probability of an event 'X'.
\(\begin{align}P(Event)\: =\: \frac{Total \:number\: of \:favorable\: outcome\: of\: an\: event}{Total\: number\: of\: outcomes} \end{align}\)(or)
\(\begin{align}P(Event)\: =\: \frac{n(X)}{n(S)} \end{align}\)
Where \(\begin{align}n(X) = the\: outcome\: of\: an\: event\end{align}\)
\(\begin{align}n(S) = the\: total\: number\: of\: events\: in\: the\: sample\: space\end{align}\)
What Is the Formula for Statistics?
There are five important formulas used in statistics. They are as follows.
|
Mean =\(\begin{align}\overline{x} = \dfrac{\sum x_i}{N}\end{align}\) \(\begin{align}x_i\end{align}\) - refers to all the terms in the data set \(\begin{align}N\end{align}\) - refers to the total number of terms if 'n' is odd Median = \(\begin{align}(\dfrac{n+1}{2}^{th}) \:\end{align}\) value if 'n' is even Median = \(\begin{align}\dfrac{1}{2}\{ {\dfrac {n}{2}\: th \:variable} + {(\dfrac{n}{2} + 1) ^{th} \:variable }\}\end{align}\) \(\begin{align}n\end{align}\) - number of values in the data set. Mode = The most frequently occuring value in a data set. Variance = \(\begin{align}\sigma^2 = \dfrac{\sum(x_i-x)^2}{N}\end{align}\) Standard Deviation = \(\begin{align}\sqrt{Variance}\end{align}\) or \(\begin{align}\sqrt{\dfrac{\sum(x_i-x)^2}{N}}\end{align}\) |
Measures of Central Value
Sometimes when we are working with large amounts of data, we need one single value to represent the whole set. In math, there are three measures to find the central value of a given set of data.
They are
- Mean
- Median
- Mode
Mean
Mean represents an average of a given set of numbers.
For example in the given data set,
\(\begin{align}3, 5, 7, 9 \end{align}\)
The mean is obtained by adding all the numbers and dividing the sum by the total count of numbers.
\(\begin{align}Mean\: = \: \dfrac{3+5+7+9}{4} \end{align}\)
\(\begin{align} =6\end{align}\)
Median
Median represents the central or middle value of a data set.
For example in the given data set,
\(\begin{align} 2, 4, 6, 8, 9, 10, 11, 13, 15, 17, 18 \end{align}\)
The median is obtained by choosing the middle value which is \(\begin{align} 10 \end{align}\).
Mode
Mode is the most frequently occurring data item.
For example in the given data set,
\(\begin{align} 30,30,31,31,31,32,32,33,33,33,33,34,35,36 \end{align}\)
The mode is obtained by choosing the most frequently occuring item in the data set.
Here, the mode is \(\begin{align} 33\end{align}\).
Measures of Spread
While measuring a central value, we are given a data set. To know how wide is the data set, we use measures of spread.
They also give us a better picture if the calculated central value (Mean, median, or mode) correctly depicts the set of values.
For example,
Here we have the marks obtained by students in a test
\(\begin{align} 25,40,55,60,70,86,90,100\end{align}\)
While calculating the average marks obtained by students in a 100 marks test, by calculating the mean, we can only find the average marks obtained by the students, but we do not know how spread the marks are from 0 to 100.
While calculating the average marks obtained by students in a \(\begin{align} 100\end{align}\) marks test, the mean score cannot be more than Here, the mode is \(\begin{align} 100\end{align}\).
In such cases, measures of spread are useful.
The most-used measures of spread are
- Range
- Quartiles and InterQuartiles Range
- Standard Deviation
- Variance
Range
Range represents the difference between the minimum and maximum values in a data set.
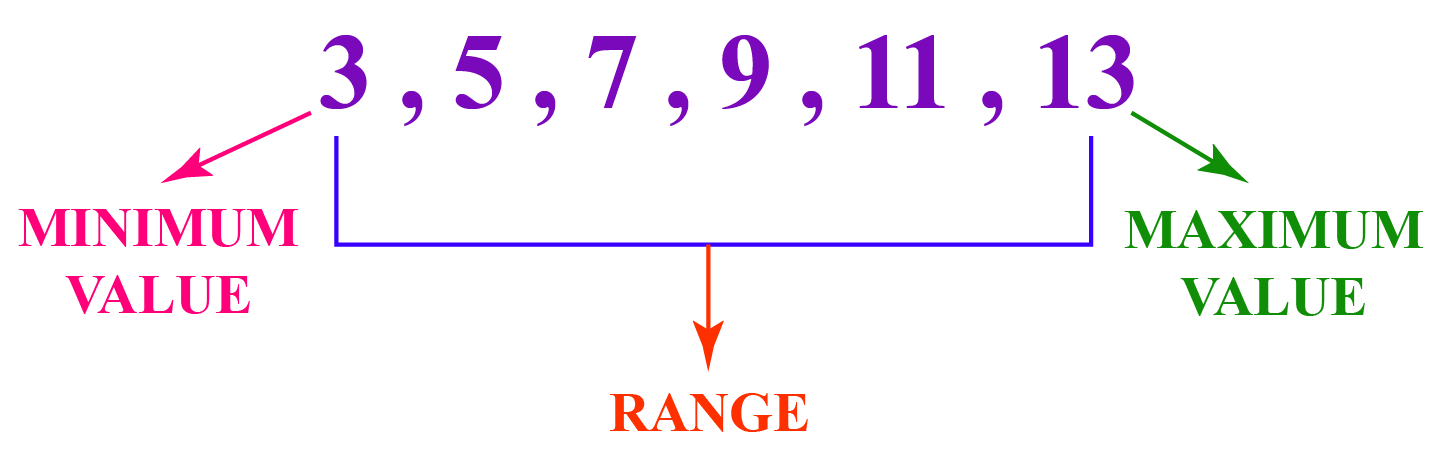
The minimum value is \(\begin{align} 3\end{align}\).
The maximum value is \(\begin{align} 13\end{align}\).
\(\begin{align} Range\: =\: 13 - 3 = 10\end{align}\)
| Range = Maximum value - Minimum value |
Quartile
As the name suggests, a quartile is a measure of spread that groups a given set of values in quarters.
To use this measure,
We first arrange the values in an increasing order.
Make four equal groups of the values.
|
\(\begin{align} First \:Quartile \:(Q1) \:= \:\dfrac{(Number\: of\: values\: in\: the\: list\: +\: 1) \times 1}{4} \end{align}\) \(\begin{align} Second \:Quartile \:(Q2) \:= \:\dfrac{(Number\: of\: values\: in\: the\: list\: +\: 1) \times 2}{4} \end{align}\) \(\begin{align} Third \:Quartile \:(Q3) \:= \:\dfrac{(Number\: of\: values\: in\: the\: list\: +\: 1) \times 3}{4} \end{align}\) |
For example, in the data set shown below,
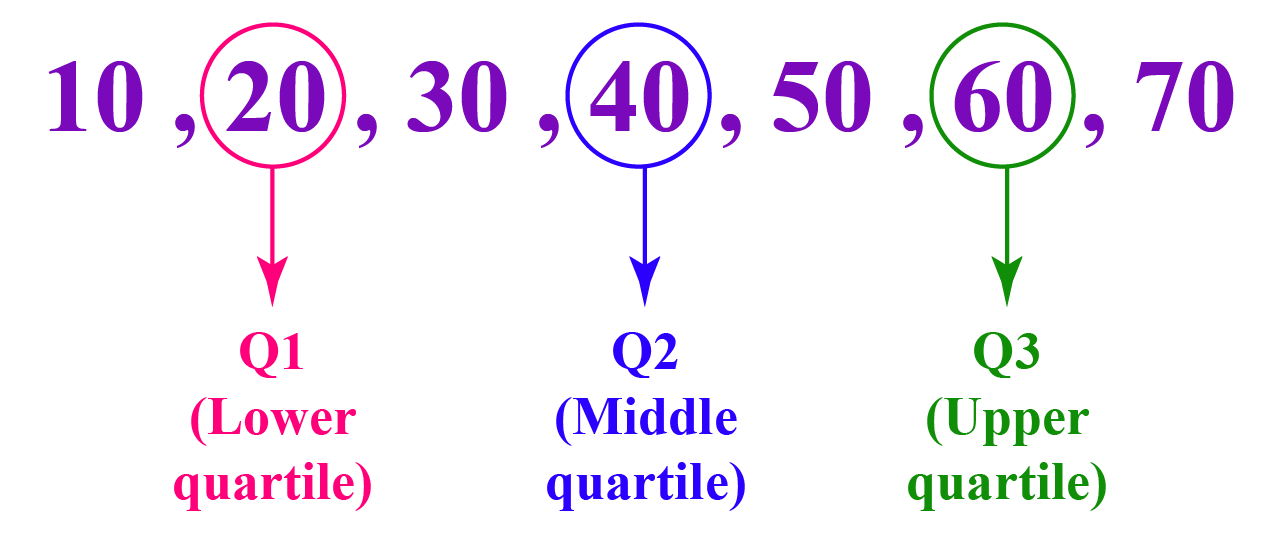
Number of values = \(\begin{align} 7 \end{align}\)
\(\begin{align}Q1 = \frac {(7+1)}{4} \times1 = 2 \end{align}\)
\(\begin{align}Q2 = \frac {(7+1)}{4} \times2 = 4 \end{align}\)
\(\begin{align}Q2 = \frac {(7+1)}{4} \times3 = 6 \end{align}\)
Interquartile
The interquartile range is obtained by subtracting the third quartile (Q3) and the first quartile (Q1). It is a place where most of the values lie in a data set or we can say sometimes the interquartile range and the mean value are the same.
For example,
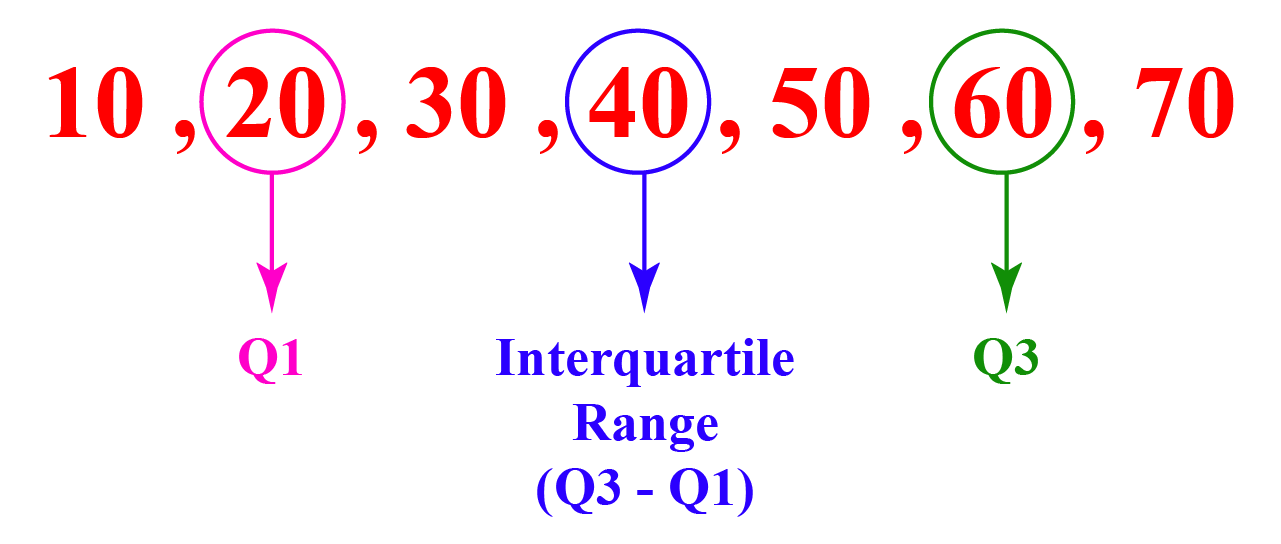
\(\begin{align} Q3\:=\:6\end{align}\)
\(\begin{align} Q1\:=\:2\end{align}\)
| Interquartile Range \(\begin{align}= Q3 - Q1 \end{align}\) |
Interquartile Range \(\begin{align}= Q3 - Q1 = 6 - 2 = 4 \end{align}\)
Variance
- Variance is a measure that gives us a approximate idea about the spread of data. It is not very accurate.
- The use of variance value is it can be used to calculate the standard deviation of a data set.
Standard Deviation
- Standard deviation is a measure that tells us how far is a data value from the mean.
- It is obtained by taking the square root of variance.
For example,
Let us say the average score to pass a test is \(\begin{align} 60\end{align}\). The score obtained by a student is \(\begin{align} 75\end{align}\). This means that the student is well above the average marks.
Comparing Data
In statistics, the following concepts are used to compare data
- Univariate and Bivariate data
- Scatter
- Outliers
- Correlation
Univariate Data
Univariate data involves comparing one type of data.
For example, we can compare the heights of students
Heights in feet and inches: 5 feet 9 inches, 5 feet 7 inches, 5 feet 5 inches, 5 feet 10 inches.
Bivariate Data
Bivariate data involves comparing two types of data.
For example, the number of shirts sold on all the days of a week. Here sales and days of the week are two types of data.
| Number of shirts sold | Day of the week |
| \(\begin{align} 5\end{align}\) | Monday |
| \(\begin{align} 10\end{align}\) | Tuesday |
| \(\begin{align} 12\end{align}\) | Wednesday |
| \(\begin{align} 17\end{align}\) | Thursday |
| \(\begin{align} 16\end{align}\) | Friday |
| \(\begin{align} 20\end{align}\) | Saturday |
| \(\begin{align} 22\end{align}\) | Sunday |
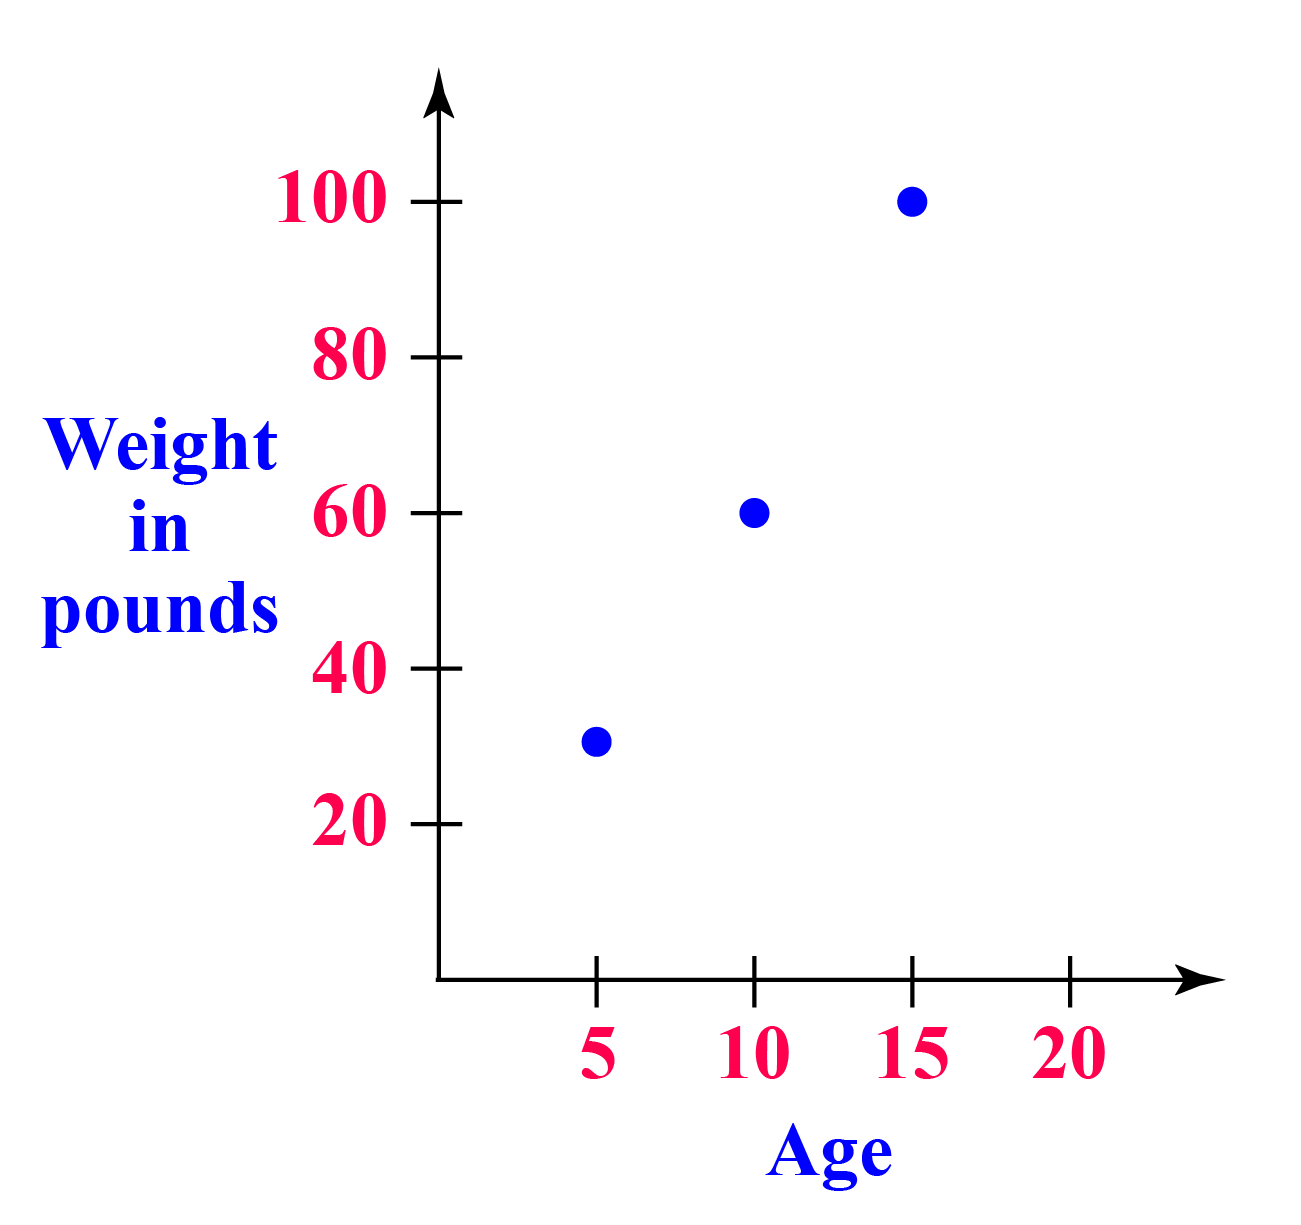
Scatter Plots
- Scatter plots are used to know how one data relates to another.
- A series of points represent the scatter plots.
For example, a graph representing the age and weight in pounds of a person is given.
We can measure how the weight increases as the age increases.
Outlier
A value that lies out of range in a given data set is called an outlier. In other words, they are the smallest and the largest extreme values.
For example,
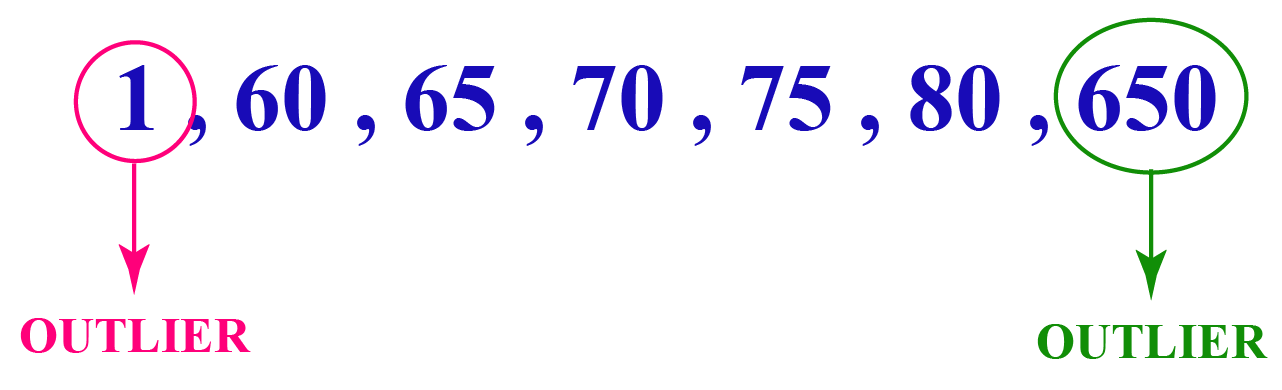
Here, \(\begin{align} 1\end{align}\) and \(\begin{align} 650\end{align}\) are extreme values which do not relate to the other values in the list.
Correlation
When two sets of data values increase or decrease together we say that they are correlated.
Correlation is positive if the two data sets increase together.
For example,
Electricity consumption increases as the number of people increases.
Correlation is negative if one value decreases as the other value increases.
For example,
The distance to cover decreases as you walk for more time.

- Outcome is the result of an event. Sample space is the total number of possible outcomes of an event.
- Value of probability always lies between 0 and 1.
- Central value of a set of data can be measured using mean, median, or mode.
Now let us discuss some probability and statistics examples.
Solved Examples
| Example 1 |
Alan rolled a dice. What is the probability of getting number \(\begin{align} 3\end{align}\)?

Solution
\(\begin{align}P(Event) = \dfrac{Number\:of \:favorable\:outcomes}{Total\:number\:of \:possible\:outcomes}\end{align}\)
Number of favorable outcome = \(\begin{align} 1\end{align}\) (We may get \(\begin{align} 3\end{align}\) when we roll a dice)
\(\begin{align}P(3) = \dfrac{1}{6}\end{align}\)
| Probability of getting 3 while rolling a dice is \(\begin{align}P(3) = \dfrac{1}{6}\end{align}\) |
| Example 2 |
Find the mean, median, and mode of the following data.
\(\begin{align}7,10,9,10,10,8,12,13,16\end{align}\)
Solution
Let us arrange the numbers in increasing order.
\(\begin{align}7,8,9,10,10,10,12,13,16\end{align}\)
\(\begin{align}Mean\:=\: \dfrac{Sum\:of\:all\:observations}{Total\:number\:of\:observations}\end{align}\)
\(\begin{align}Mean\:=\:\dfrac{7+8+9+10+10+10+12+13+16}{9}\end{align}\)
\(\begin{align}Mean\:=\:\dfrac{95}{9}\end{align}\)
\(\begin{align}Mean\:=\:10.5\end{align}\)
\(\begin{align}Median\:=\:\dfrac{Number\: of\: observations \:+\: 1 }{2}\end{align}\)
\(\begin{align}\:=\:\dfrac{9\:+\: 1 }{2}\end{align}\)
\(\begin{align}\:=\:\dfrac{10 }{2}\end{align}\)
\(\begin{align}Median\:=\:5\end{align}\)
\(\begin{align}Mode\:is\:the\:most\:frequently\:occurring\:item\end{align}\)
\(\begin{align}Mode\:=\:10\end{align}\)
|
\(\begin{align}Mean\:=\:10.5\end{align}\) \(\begin{align}Median\:=\:5\end{align}\) \(\begin{align}Mode\:=\:10\end{align}\) |
| Example 3 |
Find the range, quartile for the following set of numbers.
10, 15, 20, 25, 30, 35, 40, 45, 50, 55, 60
Solution
Range:
\(\begin{align}Range\:=\: Upper\:limit\:-\:Lower\: limit\end{align}\)
\(\begin{align}Upper\:limit\: =\: 60\end{align}\)
\(\begin{align}Lower\:limit\: =\: 10\end{align}\)
\(\begin{align}Range\: =\: 60\:-\:10\end{align}\)
\(\begin{align}Range\: =\: 50\end{align}\)
Quartile:
\(\begin{align}First\: Quartile (Q1) = \dfrac{(Number\: of\: values\: in\: the\: list\: +\: 1) \times 1}{4} \end{align}\)
\(\begin{align}Second\: Quartile (Q2) = \dfrac{(Number\: of\: values\: in\: the\: list\: +\: 1) \times 2}{4} \end{align}\)
\(\begin{align}Third\: Quartile (Q1) = \dfrac{(Number\: of\: values\: in\: the\: list\: +\: 1) \times 3}{4} \end{align}\)
Number of values in the list = 11
\(\begin{align}First\: Quartile (Q1) = \dfrac{(11\:+\: 1) \times 1}{4} \end{align}\)
\(\begin{align} = \dfrac{(12) \times 1}{4} \end{align}\)
\(\begin{align} = 3 \end{align}\)
\(\begin{align}Second\: Quartile (Q2) = \dfrac{(11\:+\: 1) \times 2}{4} \end{align}\)
\(\begin{align} = \dfrac{(12) \times 2}{4} \end{align}\)
\(\begin{align} = 6 \end{align}\)
\(\begin{align}Third\: Quartile (Q3) = \dfrac{(11\:+\: 1) \times 3}{4} \end{align}\)
\(\begin{align} = \dfrac{(12) \times 3}{4} \end{align}\)
\(\begin{align} = 9 \end{align}\)
|
\(\begin{align}Range\: =\: 50\end{align}\) \(\begin{align}First\: Quartile\: (Q1) = 3 \end{align}\) \(\begin{align}Second\: Quartile\: (Q2) = 6 \end{align}\) \(\begin{align}Third\: Quartile\: (Q3) = 9 \end{align}\)
|
Interactive Questions
Here are a few activities for you to practice. Select/Type your answer and click the "Check Answer" button to see the result.

- A random number is chosen from 1 to 100. What is the probability that it is a multiple of 8
- The mean of squares of 1, 2, 3, 4, 5 and 'a' is 17.33. Find the value of 'a'.
Let's Summarize
The mini-lesson targeted the fascinating concept of probability and statistics. The math journey around probability and statistics numbers starts with what a student already knows, and goes on to creatively crafting a fresh concept in the young minds. Trying out the probability and statistics example would enrich your knowledge on the subject. Done in a way that not only it is relatable and easy to grasp, but also will stay with them forever. Here lies the magic with Cuemath.
About Cuemath
At Cuemath, our team of math experts is dedicated to making learning fun for our favorite readers, the students!
Through an interactive and engaging learning-teaching-learning approach, the teachers explore all angles of a topic.
Be it worksheets, online classes, doubt sessions, or any other form of relation, it’s the logical thinking and smart learning approach that we, at Cuemath, believe in.
FAQs on Probability and Statistics
1. What are random variables?
The possible outcomes from a random event are called random variables.
2. Explain binomial distribution.
The probability of success or failure of an event is defined in a binomial distribution. For example, in a test, there is a probability of passing or failing.
3. Explain normal distribution.
When there are different sets of data (high or low or mixed) we need an approximate value of the given probability distribution. In that case, we use a normal distribution. It is represented using a bell curve.
4. What is sample space?
The set of all possible outcomes or results of a particular experiment or an event is called sample space.
5. What are the measures of spread in probability?
Range, quartiles, standard deviation, and variance are the measures of spread in probability.
6. What is the formula to find the probability of an event?
The probability of an event is the ratio of a number of favorable outcomes to the total number of favorable outcomes of the event.
7. What is the range of the value of probability?
The value of probability always lies between 0 and 1.
8. What are the measures of central tendency?
Mean, median, and mode are the measures of central tendency.
9. Name some of the fields that use statistics?
Business, economics, banking, and weather forecasting are some of the fields using statistics.
10. What is the difference between probability and statistics?
Probability deals with the likelihood of events whereas statistics deals with analysis and interpretation of frequency of events.
- Live one on one classroom and doubt clearing
- Practice worksheets in and after class for conceptual clarity
- Personalized curriculum to keep up with school