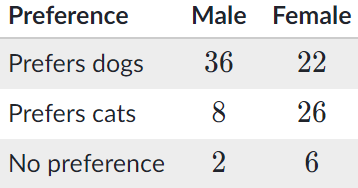
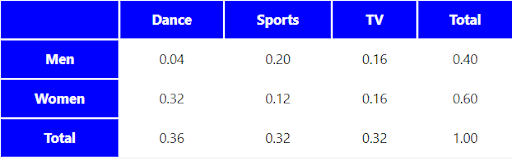
The two-way relative frequency table uses relative frequencies like percentages or proportions instead of the frequency counts. It shows what percentage of the data points fit in each category.
Conclusion
Two-way tables and frequency tables help us to represent the comparison of two variables.
This can be used in data visualization and data analysis to arrive at important decisions.
A good understanding of these also improves basic aptitude skills and logical reasoning skills.
Also read,
About Cuemath
Cuemath, student-friendly mathematics and coding platform, conducts regular Online Classes for academics and skill-development, and their Mental Math App, on both iOS and Android, is a one-stop solution for kids to develop multiple skills.
Check out the fee structure for all grades and book a trial class today!
FAQs
What is data?
Data is a collection of facts and statistics for analysis.
How do you differentiate between data and information?
Data is a collection of facts. Whereas, information is how you understand those facts.
What are the ways to represent data?
Data can be represented using graphs, tables and charts.
What are the different types of graphs?
Various types of graphs are bar graph, line graph, pictograph etc.
What is a two-way table?
Two-way table displays relative frequencies for two categorical variables.
When is a two-way table used?
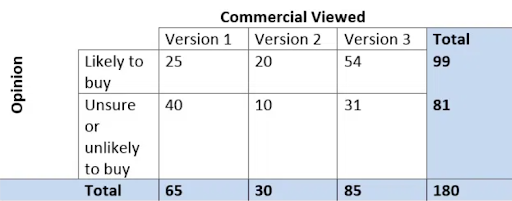
Two-way table is useful when there are different sample sizes in dataset.