Outlier
The outlier in the literary world refers to the best and the brightest people.
There is a non-fiction book 'Outliers' written by Malcolm Gladwell that debuted as the number one on the best seller books of the New York Times. Here, Malcolm describes outliers as people with exceptional intelligence, large fortunes, and who are different from the usual set of people.
Reflect your thoughts through this below image, with the outliers standing out from the crowd.
Now, let's move ahead to understand the concept of an outlier in math.
In this mini-lesson, we shall explore the topic of outliers, by finding answers to questions like what is an outlier, how to find outliers using the turkey method, how to find outliers using the interquartile range, solved examples, and interactive questions at the end.
Let's begin!
Lesson Plan
What Is an Outlier?
The extreme values in the data are called outliers.
Example: For a data set containing 2, 19, 25, 32, 36, 38, 31, 42, 57, 45, and 84
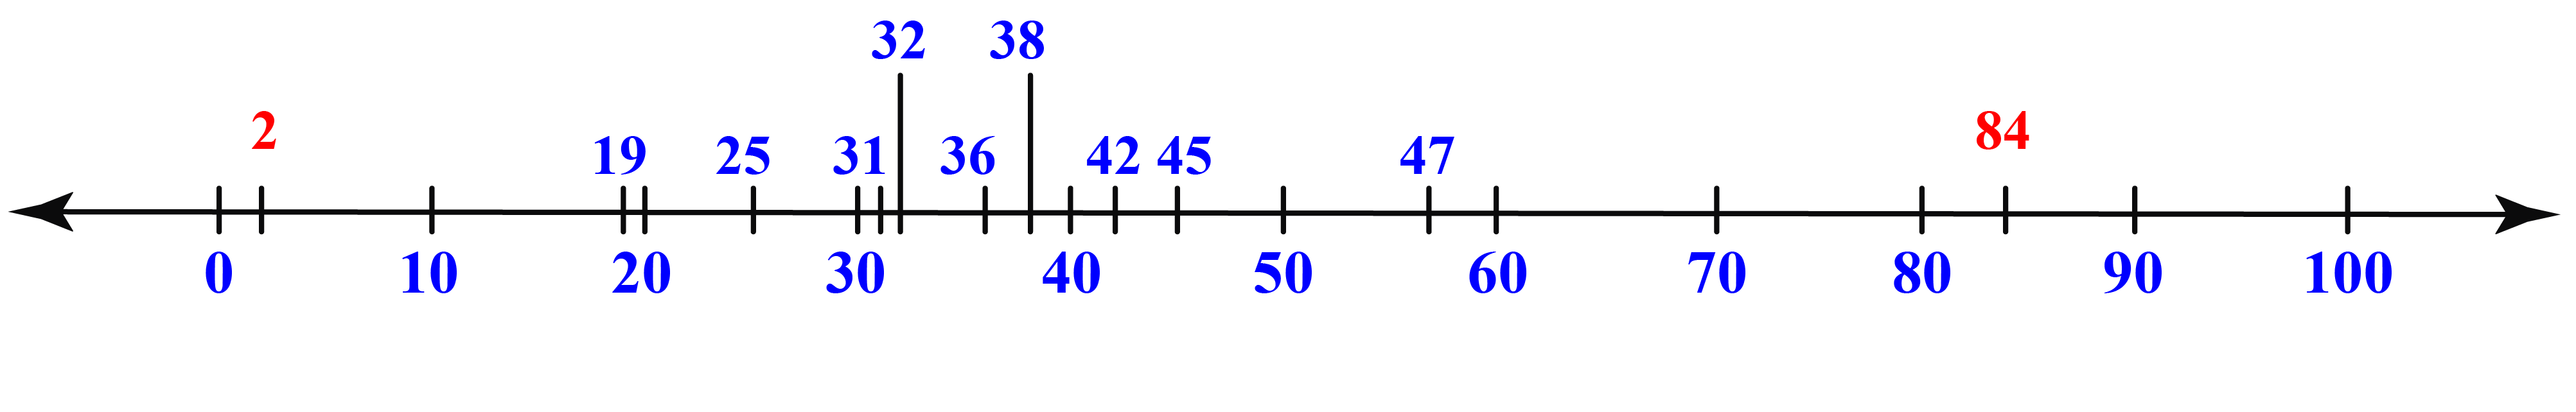
In the above number line, we can observe the numbers 2 and 84 are at the extremes and are thus the outliers.
The outliers are a part of the group but are far away from the other members of the group.
The problem with outliers: Outliers create an imbalance in the data-set and hence are generally removed from the data. Also, sometimes the outlier occurs in the data-set, due to an error.
Consider the data: 70, 73, 77, 71, 7, 73, 72, and 78
Let's calculate the mean to understand how the outlier affects the results.
Here, the datapoint 7, is an outlier.
Mean (with outlier) \(= \dfrac{70 + 73 + 77 + 71 + 7 + 73 + 72 + 78}{8} = \dfrac{521}{8} = 65.1 \)
Mean (without an outlier) \(= \dfrac{70 + 73 + 77 + 71 + 73 + 72 + 78}{7} =\dfrac{514}{7} = 73.4 \)
We can now observe how the outlier creates a variation in the mean value of the data.
Before we learn about finding the outlier, let's know about the quartiles and interquartile range.

- First Quartile(\(Q_1 \)): The mid-value of the first half of the data represents the first quartile.
- Second Quartile(\(Q_2 \)): The mid-value or the median of the data represents the second quartile
- Third Quartile(\(Q_3 \)): The mid-value of the second half of the data represents the third quartile

- Interquartile range: The difference between the first quartile(\(Q_1 \)) and the third quartile(\(Q_3 \)) of the data is the interquartile range.
How to Find the Outlier Using the Turkey Method?
Turkey method is a mathematical method to find outliers.
As per the Turkey method, the outliers are the points lying beyond the upper boundary of \(\text{Q}_3 +1.5 \text{ IQR} \) and the lower boundary of \(\text{Q}_1 - 1.5 \text{ IQR}\). These boundaries are referred to as outlier fences.
\[\text {Upper~Fence} = \text{Q}_3 +1.5 \text{ IQR} \]
\[\text {Lower~Fence} = \text{Q}_1 - 1.5 \text{ IQR} \]
The data points beyond the upper and the lower fence in this box plot are referred to as outliers.

Example
Let us find the outliers for the below data.
2, 4, 6, 8, 10, 12, 14, 16, 18, 20, and 22
The first half of the data is 2, 4, 6, 8, 10, 12, and the first quartile (mid-value of the first half of the data) is \(\text{Q}_1 = \dfrac{6 + 8}{2} = \dfrac{14}{2} = 7\)
And the second half of the data is 12, 14, 16, 18, 20, 22 and the third quartile ((mid-value of the second half of the data) is \(\text{Q}_3 = \dfrac{16 + 18}{2} = \dfrac{34}{2} =17\)
\(\text {IQR} = \text{Q}_1 - Q-3 = 17 - 7 = 10\)
\(1.5 \times \text{IQR} = 1.5 \times 10 = 15 \)
Upper boundary \(= \text{Q}_3 + 1.5 \times \text{IQR} = 17 + 15 = 32\)
Lower boundary \(= \text{Q}_1 - 1.5 \times \text{IQR} = 7 - 15 = -8\)
\(-8\) and \(32\) are the outlier fences.
There are no data points beyond -8 and 32 in this dataset.
Hence, there are no outliers.
How to Find the Outliers Using the Interquartile Range?
Ways to identify outliers: There are numerous ways to find outliers. A scatter plot or a box plot is very helpful, to identify the outliers.
Also, statistics provide a few formulae to find the outliers. Interquartile range method, Z-score, p-value(hypothesis testing) are some of the methods.
The below simulation helps to find the outliers.
First, enter the number of data points and click on the new data set. This will display the required data.
Further click on show answer. This will display the median, first quartile, third quartile, interquartile range, lower boundary, upper boundary, and the outliers.
Mild Outliers
These are the data points which lie between the boundaries
\(\text{Q}_3 + 1.5 \times \text{IQR} \) to \(\text{Q}_3 + 3 \times \text{IQR} \) on the higher side and
\(\text{Q}_1 - 1.5 \times \text{IQR}\) to \(\text{Q}_3 - 3 \times \text{IQR} \) on the lower side.
Extreme Outliers
These are the data points that lie beyond \(\text{Q}_3 + 3 \times \text{IQR} \) on the higher side and beyond \(\text{Q}_1 - 3\times \text{IQR} \) on the lower side of the data.

- Using the above definitions, find the mild outliers and extreme outliers for the below set of data points.
447, 323, 498, 371, 48, 102, 336, 983, 540, 611, 518, 453, 508, 358, 441, 393, 520, 409, 425, 388, 367, 424, and 522
Solved Examples
| Example 1 |
Sam has got a set of multiples of the numbers 4, 8, 12, 16, 20, 24, 28, 32, 36, 40, 44, 48, and 52. Help Sam to find the first quartile and the third quartile of this data.
Solution
The given data is 4, 8, 12, 16, 20, 24, 28, 32, 36, 40, 44, 48, and 52
Median = 28
The first half of the data is 4, 8, 12, 16, 20, 24, 28 and its mid-value is 16
\(\text{Q}_1\) = 16
The second half of the data is 28, 32, 36, 40, 44, 48, 52 and the mid-value is 40
\(\text{Q}_3 \) = 40
| \(\therefore \) The first quartile is 16 and the third quartile is 40 |
| Example 2 |
John has made a note of the scores of his classmates in a drawing assignment as 12, 19, 36, 33, 27, 19, 9, 66, 55, 44, 42, 71, 37, 39, 28, and 25. Help John to find the interquartile range for this set of marks.
Solution
The given data is 12, 19, 36, 33, 27, 19, 9, 66, 55, 44, 42, 71, 37, 39, 28, and 25
Arranging the data in an ascending order, we will have: 9, 12, 19, 19, 25, 27, 28, 33, 36, 37, 39, 42, 44, 55, 66, and 71
Median = 33
The first half of the data is 9, 12, 19, 19, 25, 27, 28, 33
\(\text{Q}_1\) = \(\dfrac{19 + 25}{2} \) = \(\dfrac{44}{2}\) = 22
The second half of the data is 36, 37, 39, 42, 44, 55, 66, 71
\(\text{Q}_3 \) = \(\dfrac{42 + 44}{2} \) = \(\dfrac{86}{2}\) = 43
Interquartile Range \(\text{(IQR)} = \text{Q}_3 - \text{Q}_1 \) = 43 - 22 = 21
| \(\therefore \) The interquartile range is 21 |
| Example 3 |
Dan has got the data of runs scored by a batsman as 21, 14, 26, 8, 12, 12, 14, 76, 28, 20, 32, and 38. Can you help Dan to find the outlier?
Solution
The given data is 21, 14, 26, 8, 12, 12, 14, 76, 28, 20, 32, and 38
Arranging this in ascending order, we have: 8, 12, 12, 14, 14, 20, 21, 26, 28, 32, 38, and 76
Clearly from observation, we can find that the outlier is the number 76
Further, let us apply the Turkey rule to find the outlier.
The first half of the data is 8, 12, 12, 14, 14, 20
\(\text{Q}_1 \) = \(\dfrac{12 + 14}{2} \) = \(\dfrac{26}{2}\) = 13
The second half of the data is 21, 26, 28, 32, 38, 76
\(\text{Q}_3 \) = \(\dfrac{28 + 32}{2} \) = \(\dfrac{60}{2}\) = 30
Interquartile range \(\text{(IQR)} = \text{Q}_3 - \text{Q}_1 \) = 30 - 13 = 17
\(1.5 \text{IQR} = 1.5 \times 17 = 25.5\)
Upper Boundary = \(\text{Q}_3 + 1.5\times\text{IQR} = 30 + 25.5 = 55.5\)
Lower Boundary = \(\text{Q}_1 - 1.5\times\text{IQR} = 13 - 25.5 = -12.5\)
The outlier boundaries are -12.5 and 55.5, and the number 76 lies beyond this boundary.
| \(\therefore\) 76 is the outlier. |
| Example 4 |
Rachel has collected the data of the marks scored by her classmates in a math test. The scores are 23, 28, 22, 33, 25, 35, 36, 33, 44, 87, and 42
Can you help Rachel to understand how the removal of outliers from the data, changes the values of mean, median, and mode?
Solution
The given data is 23, 28, 22, 25, 35, 36, 33, 44, 87, and 42
Arranging it in ascending order, we have 22, 23, 25, 38, 33, 33, 35, 36, 42, 44, and 87
Without applying any statistical method and by simple observation we can find that the outlier is 87
Let us find the mean, median, and mode for this data.
Mean = \(\dfrac{22 + 23 + 25 + 38 + 33 + 33 + 35 + 36 + 42 + 44 + 87}{11}\) = \(\dfrac{418}{11} \) = 38
Median = 33
Mode = 33
Now after removing the outlier, let us calculate the mean, median, and mode.
Mean = \(\dfrac{22 + 23 + 25 + 38 + 33 + 33 + 35 + 36 + 42 + 44 }{11}\) = \(\dfrac{331}{11} \) = 30.9
Median = 33
Mode = 33
Hence, we can observe that the value of only the mean has changed but the median and the mode remain the same.
|
\(\therefore \) On removing the outlier, only the mean value has changed. |
Interactive Questions on Outlier Definition
Here are a few activities for you to practice. Select/Type your answer and click the "Check Answer" button to see the result.
Let's Summarize
The mini-lesson targeted the fascinating concept of an outlier. The math journey around outlier starts with what a student already knows, and goes on to creatively crafting a fresh concept in the young minds. Done in a way that not only it is relatable and easy to grasp, but also will stay with them forever. Here lies the magic with Cuemath.
About Cuemath
At Cuemath, our team of math experts is dedicated to making learning fun for our favorite readers, the students!
Through an interactive and engaging learning-teaching-learning approach, the teachers explore all angles of a topic.
Be it worksheets, online classes, doubt sessions, or any other form of relation, it’s the logical thinking and smart learning approach that we, at Cuemath, believe in.
Frequently Asked Questions
1. How does removing the outlier affect the mean?
Removing an outliner changes the value of the mean. Let us understand this with sample data of 10, 11, 14, 15, and 55
Mean = \(\dfrac{10 + 11 + 14 + 15 + 55}{5} \) = \(\dfrac{105}{5} \) = 21
Mean (without the outlier) = \(\dfrac{10 + 11 + 14 + 15}{4} \) = \(\dfrac{50}{4} \) = 12.5
Here, on removing the outlier 55 from the sample data the mean changes from 21 to 12.5
2. When should we remove outliers?
Errors in data entry or insufficient data collection process result in an outlier. In such instances, the outlier is removed from the data, before further analyzing the data.
Also sometimes the outliers rightly belong to the dataset and cannot be removed. An example is the marks scored by the students in which the student gaining a 100 mark (full marks) is an outlier, which cannot be removed from the dataset.
3. Can normal distribution have outliers?
A normal distribution also has outliers. The Z-value helps to identify the outliers.
\( Z = \frac{x - \mu}{\sigma} \) where \(\mu \) is the mean of the data and \(\sigma \) is the standard deviation of the data.
The data with Z-values beyond 3 are considered as outliers.
4. What percent of a normal distribution are outliers?
About 0.3% of the normal distribution are outliers.
65%, 95%, 99.7% of the data are within the Z value of 1, 2 & 3 respectively. The data beyond the Z value of 3, represent the outliers. Since 99.7% of the data is within the Z value of 3, the remaining data of 0.3% is the outliers.
- Live one on one classroom and doubt clearing
- Practice worksheets in and after class for conceptual clarity
- Personalized curriculum to keep up with school