Jan 8 2021
Reading Time: 4 Minutes
Data Handling is a process of gathering, recording, and presenting information in a way that is helpful to others in using (read or fetch information) for instance, in graphs or charts. It is sometimes also known as statistics.
It is also used for comparing data and taking out mean, median, and mode. Which is useful for both maths and science.
Data is often organized in graphs or charts for analysis and may include facts, numbers, or measurements.
Also read:
Pictographs:
Data handling is a set of skills, which includes, collecting data, keeping records of data, analysis of data, and sharing data. Data handling may be as simple as orderly recording on a sheet of paper or the completion of entry forms on a computer screen.
Download the PDF below to understand the types of data used in Mathematics and its applications.
| 📥 |
Introduction to Data Handling and its Types |
Download
|
Types of Data
Quantitative data: gives numerical information
-
Continuous data
-
Discrete data
Qualitative data: gives descriptive information
Types of Data Handling
Data can be represented in different types, for eg:
- Bar Graph
- Pictograph
- Line Graph
- Stem and Leaf Plots
- Histogram
- Dot Plots
- Cumulative Tables and graphs
- Frequency Distribution
We will discuss here Bar Graphs and Line Graphs as they are the most common methods of data representation.
Bar Graph
Example: The given bar graph represents Demand and Production for five companies A, B, C, D, and E. On the basis of the graph, answer the following questions.
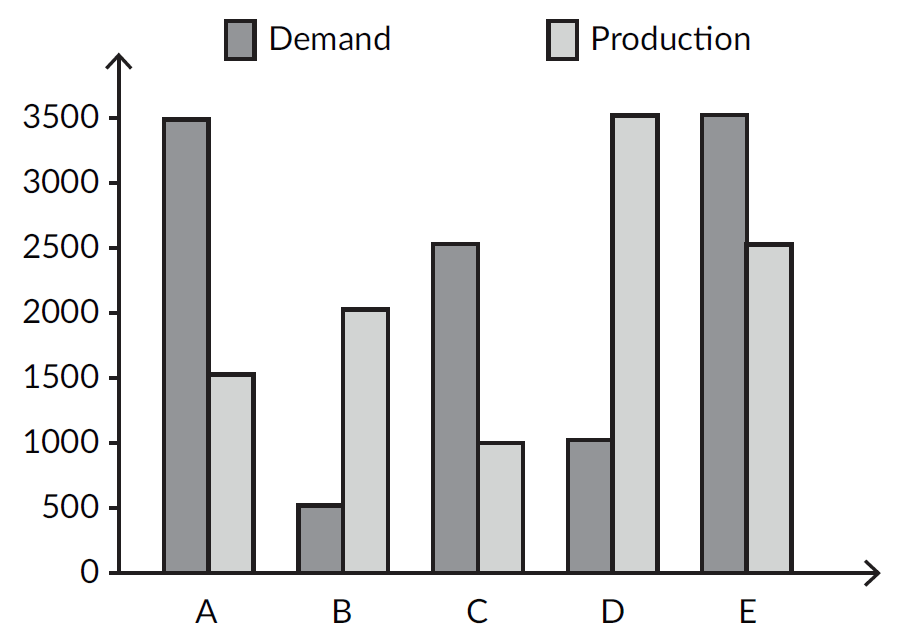
- If x% of demand for company C equal demand for company B, then x equals
- The ratio of the number of companies having more demand than production to those having more production than demand is
(i) (ii)
(A) \(20\) \(4 : 1\)
(B) \(20\) \(3 : 2\)
(C) \(60\) \(2 : 2\)
(D) \(20\) \(9:10\)
Answer: x% of demand for company C = demand for company B
Demand for company C =\(2500\); Demand for company B = \(500\). So when we compare demand for company c and demand of company B; we get \(500*100/2500=20\)%.
The ratio of the number of companies having more demand than production to those having more production than demand is \(3 : 2\); as 3 companies are having more demand than production.
Line Graphs
Example: The given line graph shows the number of cameras sold by a ship from July to December.
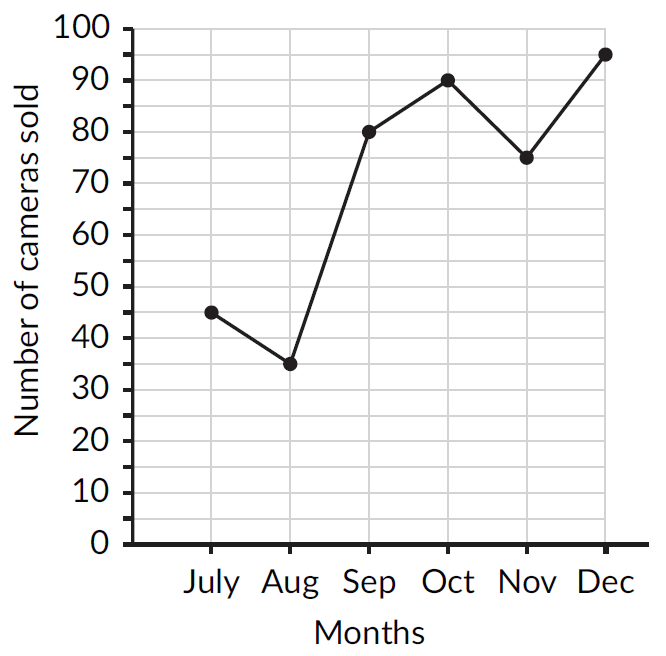
The sales of cameras in the first half of the year (January to June) was 20% more than the sales in the second half of the year (July to December). How many more cameras did the shop sell in the first half of the year?
(A) \(68\)
(B) \(42\)
(C) \(72\)
(D) \(84\)
Answer: Sales of the second half of the year=\(45+35+80+90+75+95=420\);
Now, Sales of the first half of the year= \(20\) % more than the sales of second-half i .e; \((420*120)/100=504\);
Now, How many more cameras did the shop sell in the first half of the year? For that \(504-420=84\) cameras, the shop sold in the first half of the year.
Calculation of Mean, Median, and Mode
Mean means average. To calculate the mean, add together all of the numbers or data points (values) in your data set. Then divide that sum by the number of values in the data set.
Median is the middle number when listed in either ascending (least to greatest) or descending (greatest to least) order.
The mode tells us the number that occurred the most often in the data set.
The Range is the difference between the highest and lowest values in the data set.
Example: Find the mean, median, mode, and range for the following list of values 5, 13, 9, 7, 1, 9, 2, 9, and 11
Answer: Mean= 5+13+9+7+1+9+2+9+11=66 ; 66/9 = 7.33
Median= 9; the middle number when we arrange numbers in Ascending or Descending : 1,2,5,7,9,9,9,11,13
Mode=9; the number that occurs most often
Range=13-1=12; the difference between the highest and the lowest values in the data set.
Example Problems
Question 1: A bar graph is drawn to a scale of 1 cm = r units. The length of the bar representing a quantity of 208 units is 2.6 cm. Find the value of r.
(A) 100 (B) 70 (C) 80 (D) 75
Question 2: What is the mean of the first ten prime numbers?
A) 10.9 (B) 10 (C) 14.3 (D) 12.9
Question 3: The mean age of 20 students is 20 years. 5 students with the mean age of 17 years leave the class. What is the meaning of the ages of the remaining students in the class?
A) 31 years (B) 24 years (C) 28 years (D) 21 years
Question 4: What is the median value of the set of observations given: 98, 75, 96, 180, 270, 102, 94, 100, 610, 200, 75, 80
(A) 100 (B) 98 (C) 97 (D) 99
Question 5: The average age of a group of eight members of a club remains the same as it was 3 years ago, if a young member is substituted for an old member. By how much is the incoming member younger compared to the outgoing member?
(A) 11 years (B) 24 years (C) 28 years (D) 16 years
Question 6: A milkman buys milk at र7, र8 and र8 per liter for three successive years. What approximately is the average cost per litre of milk if he spends र4000 each year?
(A) र7.98 (B) र8 (C) र8.50 (D) र7.67
Question 7: In a pie chart representing the percentages of students having an interest in reading various kinds of books, the central angle of the sector representing students reading novels is 81°. What is the percentage of students interested in reading novels?
(A) 15% (B) 18% (C) 22.5% (D) 27.5%
Question 8: In a pie chart representing the number of students opting for different streams of study out of a total strength of 1650 students, the central angle of the sector representing arts students is 48°. What is the number of students who opted for the arts stream?
(A) 220 (B) 240 (C) 275 (D) 320
Summary
What we learned in the above article, we can summarise in below points.
- To read and interpret bar and Line graphs.
- Learning how to represent data or information.
- Calculating mean, mode, and median using the formulas.
Data handling is used for organizing ur data properly
Importance --
1)In libraries -To keep a record of books.
2)Doctors keep records of patients
3)Meteorologists take records of the weather
4)Astrologists record the movement of stars
5)For recording water levels in rivers.
6)For recording the economical income of each household.
7)For recording on a graph, the progress you have made in your studies
About Cuemath
Cuemath, a student-friendly mathematics platform, conducts regular Online Classes for academics and skill-development, and their Mental Math App, on both iOS and Android, is a one-stop solution for kids to develop multiple skills. Understand the Cuemath Fee structure and sign up for a free trial.
Frequently Asked Questions (FAQs)
How to find mean in data handling?
Mean is nothing but the average of the set of data given. To calculate the mean, add together all of the numbers in your data set. Then divide that sum by the number of values in the data set.
What is class size in data handling?
Class size is nothing but called range, which is the difference between the upper limit and the lower limit.
What is data handling?
A collection of data represented in a particular manner, to take out some valuable information.
-Written by Monal Mashru, Cuemath Teacher