Summary statistics
Summary statistics helps us summarize statistical information.
Let's consider an example to understand this better.
A school conducted a blood donation camp.
The blood groups of 30 students were recorded as follows.
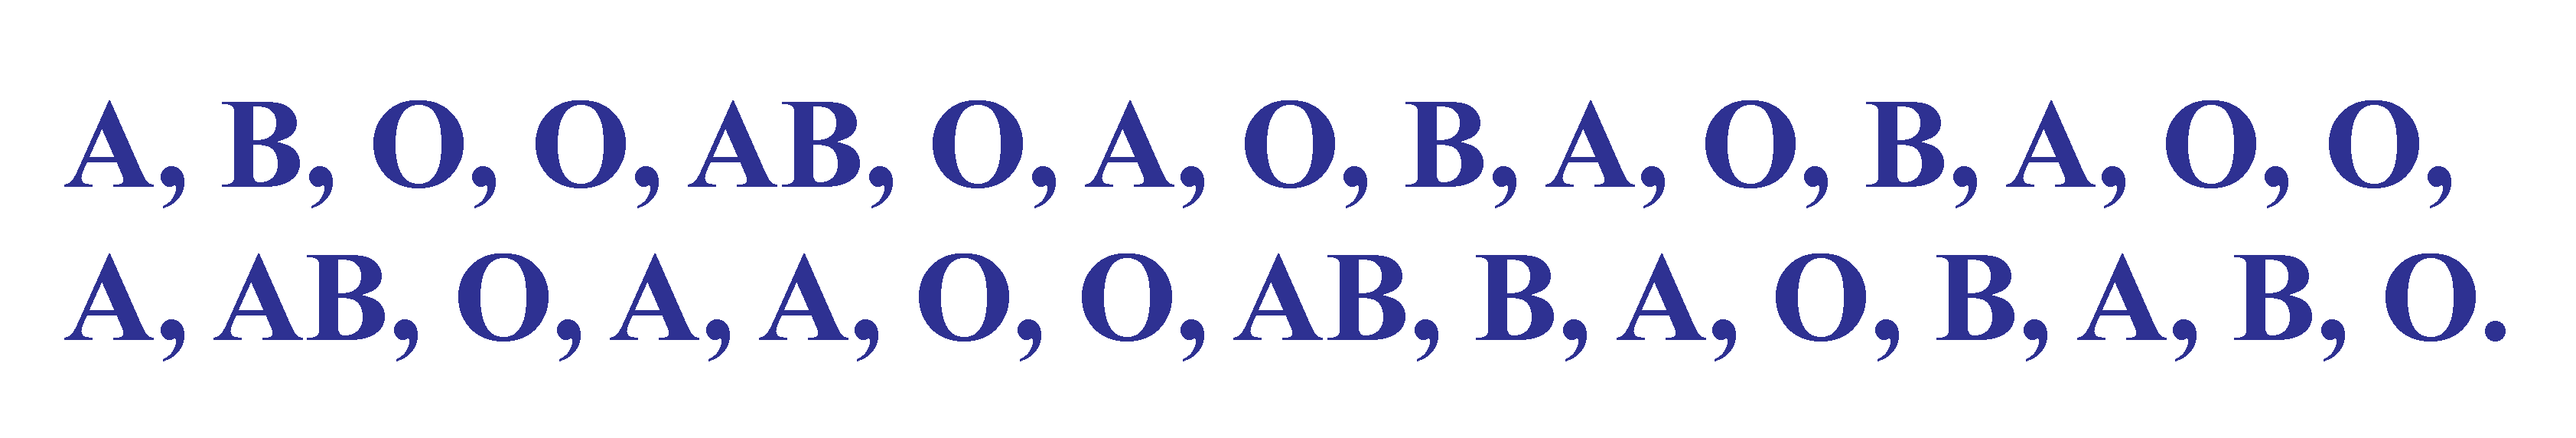
We can represent this data in a tabular form.
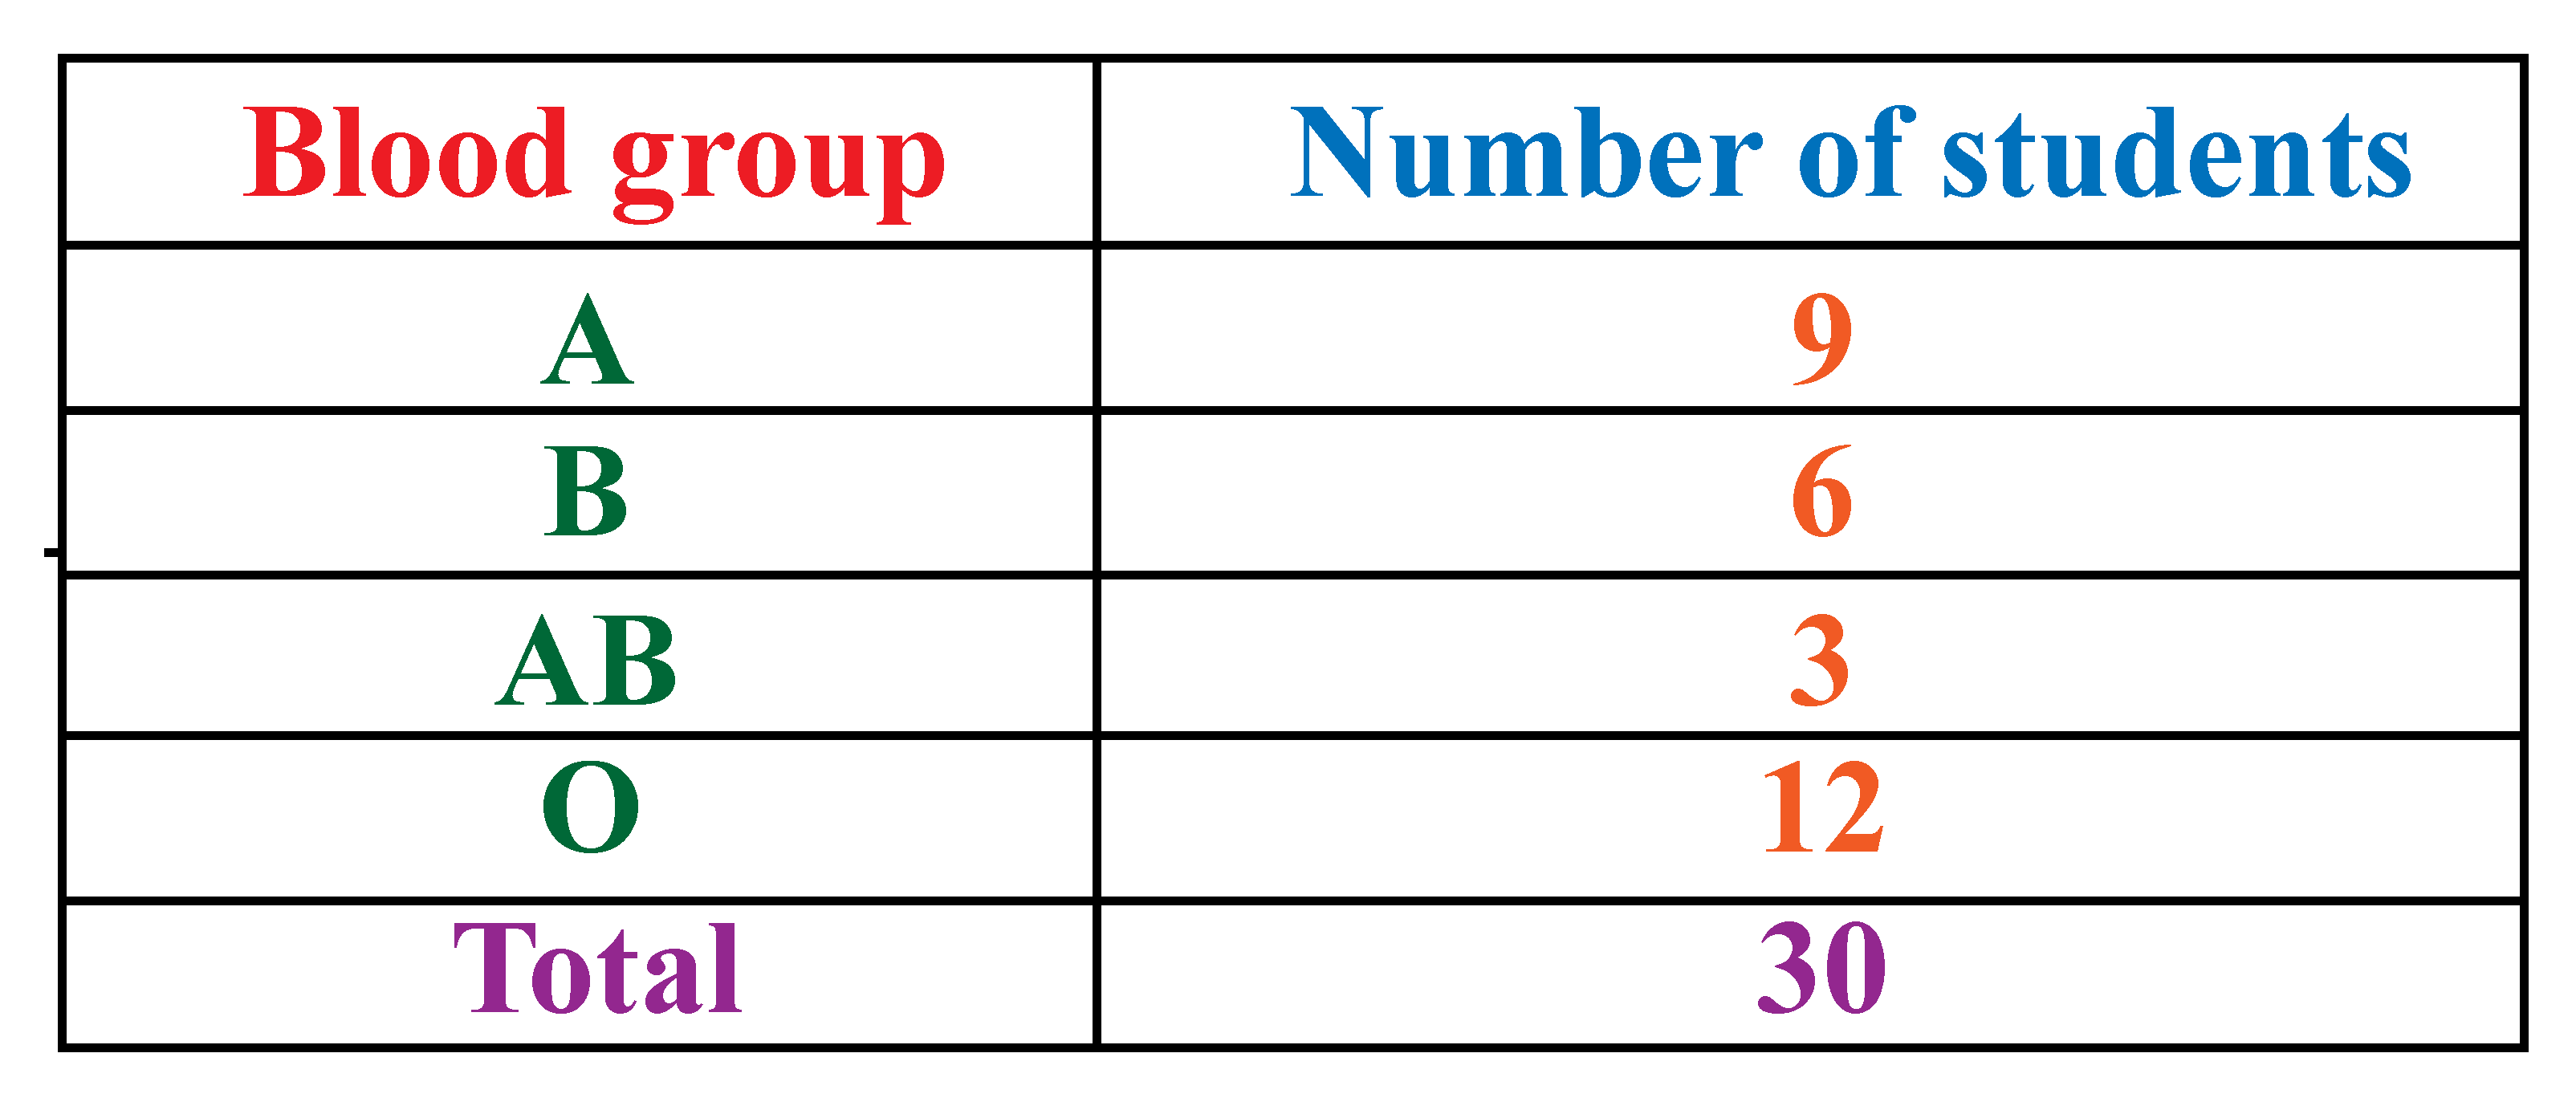
This table is known as a frequency distribution table.
You can observe that all the collected data is organized under two columns.
This makes it easy for us to understand the given information.
Thus, summary statistics condenses the data to a simpler form so that it is easy for us to observe its features at a glance.
We will learn more about summary statistics as we scroll down. Try your hand at solving some interactive questions at the end.
Lesson Plan
Summary Statistics
Let us first understand the meaning of summary statistics.
Definition of Summary Statistics: Summary statistics is a part of descriptive statistics that summarizes and provides the gist of the information about the sample data.
Summary statistics deals with summarizing statistical information.
This indicates that we can efficiently use summary statistics to quickly get the gist of the information.
Statistics generally deals with the presentation of information quantitatively or visually.
"Summary statistics" is a part of descriptive statistics.
Descriptive statistics deals with the collection, organization, summaries, and presentation of data.
What Is a Summary Statistics Table?
Big data related to population, economy, stock prices, and unemployment needs to be summarized systematically to interpret it correctly.
It is usually done using a summary statistics table.
The summary table is a visual representation that summarizes statistical information about the data in a tabular form.
Here are a few summary statistics about a certain country:
- The population of the country now stands at 1,351,800.
- 60% of people describe their health as very good or excellent.
- 20,800 have immigrated into the country while 21,500 people emigrated out of the country.
- The per capita gross annual pay now stands at $21,000.
- There were 105,023 recorded crimes.
- Unemployment is at 2.8%.
How Do you Explain Summary Statistics?
Summary statistics is a part of descriptive statistics that summarizes and provides the gist of information about the sample data.
Statisticians commonly try to describe and characterize the observations by finding:
- a measure of location, or central tendency, such as the arithmetic mean
- a measure of statistical dispersion like the standard mean absolute deviation
- a measure of the shape of the distribution like skewness
- if more than one variable is measured, a measure of statistical dependence such as a correlation coefficient
How Do you Analyze Summary Statistics?
In a class, the collection of scores obtained by 30 students is the description of data collected.
To find the mean of the data, we will need to find the average marks of 30 students.
If the average marks obtained by 30 students is 75 out of 100, then we can derive a conclusion or give judgment about the performance of the students on the basis of this result.

1. Summary statistics helps us get the gist of the information instantly.
2. Statisticians describe the observations using the following measures.
- Measure of location, or central tendency: arithmetic mean
- Measure of statistical dispersion: standard mean absolute deviation
- Measure of the shape of the distribution: skewness
- Measure of statistical dependence: correlation coefficient
Measures of Location
The arithmetic mean, median, mode, and interquartile mean are the common measures of location or central tendency.
Measures of Spread
Standard deviation, range, variance, absolute deviation, interquartile range, distance standard deviation, etc. are the common measures of spread/dispersion.
The coefficient of variation (CV) is a statistical measure of the relative spread of data points around the mean.
Graphs / charts
Some of the graphs and charts frequently used in the statistical representation of the data are given below.
Graphs:
- Line graph
- Bar graph
- Histogram
- Scatter plot
- Frequency distribution graph
Charts:
- Flow chart
- Pie chart
Solved Examples on Summary Statistics
| Example 1 |
The mean monthly salary of 10 workers of a group is $1445
One more worker whose monthly salary is $1500 has joined the group.
Find the mean monthly salary of 11 workers of the group.
Solution
Here, \(n=10, \bar{x}=1445\)
Using the formula,
\begin{align} \bar{x}&=\dfrac{\sum x_i}{n} \\\therefore \sum x_i&= \bar{x} \times n\\\sum x_i&= 1445 \times 10\\&=14450\\\text {10 workers salary} & = $14450\\\text {11 workers salary} & = 14450+1500\\&= $15950\\\text {Average salary} &=\dfrac{15950}{11} \\&= 1450\end{align}
|
\( \therefore \text{Average salary of 11 workers}\!= \!$1450\) |
| Example 2 |
The pie chart shows the favorite subjects of students in a class.
Using the information given in the pie chart, determine the percentage of students who chose English.

Solution
We know that \(144^\circ +36^\circ+72^\circ+108^\circ= 360^\circ\)
The percentage of students who chose English \[\begin{align}&=\dfrac{72}{360}\times 100\\&=20\end{align}\]
|
\(\therefore\) The percentage of students who chose English = 20 |
| Example 3 |
On World Environment Day, 100 schools decided to plant 100 tree saplings in their gardens.

The following data shows the number of plants that survived in each school after one month.
| 95 | 67 | 28 | 32 | 65 | 65 | 69 | 33 | 98 | 96 |
|---|---|---|---|---|---|---|---|---|---|
| 76 | 42 | 32 | 38 | 42 | 40 | 40 | 69 | 95 | 92 |
| 75 | 83 | 76 | 83 | 85 | 62 | 37 | 65 | 63 | 42 |
| 89 | 65 | 73 | 81 | 49 | 52 | 64 | 76 | 83 | 92 |
| 93 | 68 | 52 | 79 | 81 | 83 | 59 | 82 | 75 | 82 |
| 86 | 90 | 44 | 62 | 31 | 36 | 38 | 42 | 39 | 83 |
| 87 | 56 | 58 | 23 | 35 | 76 | 83 | 85 | 30 | 68 |
| 69 | 83 | 86 | 43 | 45 | 39 | 83 | 75 | 66 | 83 |
| 92 | 75 | 89 | 66 | 91 | 27 | 88 | 89 | 93 | 42 |
| 53 | 69 | 90 | 55 | 66 | 49 | 52 | 83 | 34 | 36 |
Using this data, can you find the number of schools that were able to retain 50% of the plants or more?
Solution
We need to represent this large amount of data in such a way that a reader can understand it easily.
To include all the observations in groups, we will create various groups of equal intervals.
These intervals are called class intervals.

From this table, it is clear that 50% or more plants survived in (8 + 18 + 10 + 23 + 12) schools.
|
\(\therefore\) 71 schools were able to retain 50% or more plants in their garden. |

-
Which of the following data sets has the second-largest arithmetic mean?
A = {First five whole numbers}
B = {First five natural numbers}
C = {First five even numbers}
D = {First five odd numbers} -
A scientist is studying reaction times. She believes that 5% of scores have an error as they are farthest from the mean. The mean reaction time is 7 and the standard deviation is 0.5. Which highest and lowest reaction times should be eliminated?
Interactive Questions on Summary Statistics
Here are a few activities for you to practice. Select/Type your answer and click the "Check Answer" button to see the result.
Let's Summarize
This mini-lesson targeted the fascinating concept of summary statistics. The math journey around the summary statistics starts with what a student already knows, and goes on to creatively crafting a fresh concept in the young minds. Done in a way that not only it is relatable and easy to grasp, but also will stay with them forever. Here lies the magic with Cuemath.
About Cuemath
At Cuemath, our team of math experts is dedicated to making learning fun for our favorite readers, the students!
Through an interactive and engaging learning-teaching-learning approach, the teachers explore all angles of a topic.
Be it problems, online classes, doubt sessions, or any other form of relation, it’s the logical thinking and smart learning approach that we, at Cuemath, believe in.
FAQs on Summary Statistics
What is included in summary statistics?
Summary statistics summarize and provide information about the collected data. It characterizes the values in your data set. It tells us where the average lies and whether the data is skewed.
What is the most common summary statistic?
The mean and the median are most commonly used in statistical analysis.
What is a summary statistic table?
The summary table is a visual representation that summarizes statistical information about data in a tabular form.
What does the five-number summary tell you?
A five-number summary is useful in descriptive analyses or during the initial interpretation of a large data set. It consists of five values: the maximum and minimum values, the lower and upper quartiles, and the median.
What is the purpose of the summary table?
Summary tables are a visual representation of the data making it easier to understand.
What is a summary in math?
Summary in math is a quick and simple description of the data.
How do you describe statistics?
Summary statistics help us to condense the data in a simpler form so that it is easy for us to observe and describe its features at a glance.
What are the types of statistics?
Types of statistics are:
- Descriptive statistics
- Inferential statistics
- Live one on one classroom and doubt clearing
- Practice worksheets in and after class for conceptual clarity
- Personalized curriculum to keep up with school