visual curriculum
Table of Contents
| 1. | Introduction |
| 2. | Absolute Value Graph |
| 3. | Graphing Absolute Value functions |
| 4. | Function Transformations in Graphing Absolute Value Equations |
| 5. | Summary |
| 6. | FAQs |
28 December 2020
Read time: 5 minutes
Introduction
We have already understood in detail about the absolute function in the blog about the absolute value function. Let us move on to a major aspect of solving absolute value equations which is drawing the necessary graph, looking at the intercepts and vertex.
Hence, graphing absolute value functions is an important topic which we will reduce to a step by step easy process.
Absolute value graph-PDF
Cuemath’s learning platform has carefully designed simulations to help the student visualize concepts. This blog will help us understand the absolute value graph. Here is a downloadable PDF to explore more.
| 📥 | Absolute value graph-PDF |
Absolute Value Graph
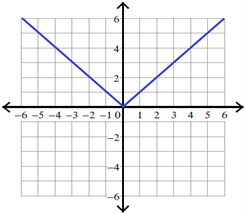
Let us look at the most basic absolute value function graph,
\[y = |x|\]
Most of the absolute value function graphs will have a somewhat similar shape, a V-like structure with a vertex. Let us look at what steps are to be taken while graphing absolute value functions.
Graphing Absolute Value functions
The following steps will be useful in graphing absolute value functions.
How to graph an absolute value function?
Step 1:
Before graphing any absolute value function, first we have to graph the absolute value parent function:
\[y = |x|\]
Its vertex is (0,0)
Let us take some random values for x.
\[\begin{align}x &= - 3 \quad\rightarrow\quad y = |-3| = 3 \quad\rightarrow\quad (-3, 3)\\x &= - 2 \quad\rightarrow\quad y = |-2| = 2 \quad\rightarrow\quad (-3, 3)\\x &= - 1 \quad\rightarrow\quad y = |-1| = 1 \quad\rightarrow\quad (-3, 3)\\x &= 0 \quad\rightarrow\quad y = |0| = 0 \quad\rightarrow\quad (0, 0)\\x &= 1 \quad\rightarrow\quad y = |1| = 1 \quad\rightarrow\quad (1, 1)\\x &= 2 \quad\rightarrow\quad y = |2| = 2 \quad\rightarrow\quad (2, 2)\\x &= 3 \quad\rightarrow\quad y = |3| = 3 \quad\rightarrow\quad (3, 3)\end{align}\]
If we plot these points on the graph sheet, we will get a graph as given below.

When we look at the above graph, clearly the vertex is (0, 0)
Step 2: Write the given absolute value function as \(y - k = |x - h|\)
Step 3: To get the vertex of the absolute value function above, equate (x - h) and (y - k) to zero, That is,
\(x - h = 0\) and \(y - k = 0\)
\(x = h\) and \(y = k\)
Therefore, the vertex is
\((h, k)\)
According to the vertex, we have to shift the above graph.
Note:
If we have negative signs in front of absolute signs, we have to flip the curve over.
| Example |
\[y = - |x|\]
These steps should be kept in mind in graphing absolute value function. We now take more complex absolute function examples.
Graphing Absolute Value Functions Solved Examples
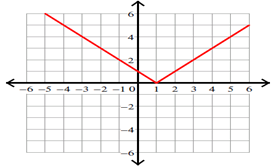
| Example 1 |
Graphing absolute value function given below.
\[y = |x - 1|\]
Solution :
The given absolute value function is in the form :
\[y - k = |x - h|\]
That is,
\[y = |x - 1|\]
To get the vertex, equate (x - 1) and y to zero.
\(x - 1 = 0\) and \(y = 0\)
\(x = 1\) and \(y = 0\)
Therefore, the vertex is
| (1, 0) |
So, the absolute value graph of the given function is
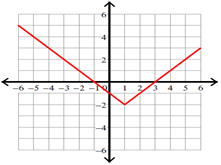
| Example 2 |
Absolute value graph of:
\[y = |x - 1| - 2\]
Solution :
Write the given absolute value function in the form :
\[y - h = |x - h|\]
That is,
\[y = |x - 1| - 2\]
Add 2 to each side.
\[y + 2 = |x - 1|\]
To get the vertex, equate (x - 1) and (y + 2) to zero.
\(x - 1 = 0\) and \(y + 2 = 0\)
\(x = 1\) and \(y = -2\)
Therefore, the vertex is
| \((1, -2)\) |
So, the absolute value graph of the given function is
| Example 3 |
Graph the absolute value function given below.
\[y = |x + 3| + 3\]
Solution :
Write the given absolute value function in the form :
\[y - h = |x - h|\]
That is,
\[y = |x + 3| + 3\]
Subtract 3 from each side.
\[y - 3 = |x + 3|\]
To get the vertex, equate (x + 3) and (y - 3) to zero.
\(x + 3 = 0\) and \(y - 3 = 0\)
\(x = -3\) and \(y = 3\)
Therefore, the vertex is
| \((-3, 3)\) |
So, the absolute value graph of the given absolute value function is

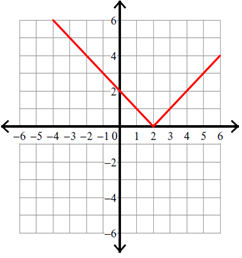
| Example 4 |
How to graph absolute value:
\[y = |x - 2|\]
Solution :
The given absolute value function is in the form :
\[y - k = |x - h|\]
That is,
\[y = |x - 2|\]
To get the vertex, equate (x - 2) and y to zero.
\(x - 2 = 0\) and \(y = 0\)
\(x = 2\) and \(y = 0\)
Therefore, the vertex is
| \((2, 0)\) |
So, the absolute value graph of the given absolute value function is
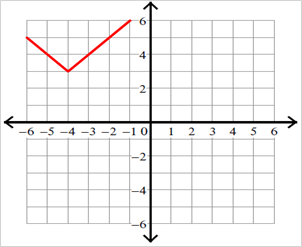
| Example 5 |
How to graph absolute value:
\[y = |x + 4| + 3\]
Solution :
Write the given absolute value function in the form :
\[y - h = |x - h|\]
That is,
\[y = |x + 4| + 3\]
Subtract 3 from each side.
\[y - 3 = |x + 4|\]
To get the vertex, equate (x + 4) and (y - 3) to zero.
\(x + 4 = 0\) and \(y - 3 = 0\)
\(x = -4\) and \(y = 3\)
Therefore, the vertex is
| \((-4, 3)\) |
So, the absolute value graph of the given absolute value function is
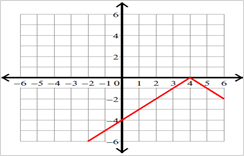
| Example 6 |
How to graph absolute value:
\[y = |x - 4| - 4\]
Solution :
Write the given absolute value function in the form :
\[y - h = |x -h|\]
That is,
\[y = |x - 4| - 4\]
Add 4 to each side.
\[y + 4 = |x - 4|\]
To get the vertex, equate (x - 4) and (y + 4) to zero.
\(x - 4 = 0\) and \(y + 4 = 0\)
\(x = 4\) and \(y = -4\)
Therefore, the vertex is
| \((4, -4)\) |
So, the absolute value graph of the given absolute value function is
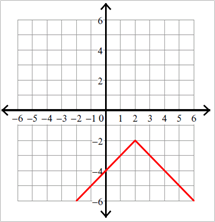
| Example 7 |
How to graph absolute value equations
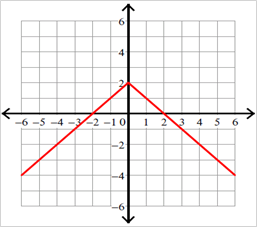
\[y = -|x - 2| - 2\]
Solution :
Write the given absolute value function in the form
\[y - h = |x - h|\]
That is,
\[y = -|x - 2| - 2\]
Add 2 to each side.
\[y + 2 = -|x - 2|\]
To get the vertex, equate (x - 2) and (y + 2) to zero.
\(x - 2 = 0\) and \(y + 2 = 0\)
\(x = 2\) and \(y = -2\)
Therefore, the vertex is
| \((2, -2)\) |
Because there is a negative sign in front of the absolute sign, we have to flip the curve over.
So, the absolute value graph of the given absolute value function is
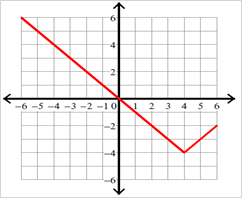
| Example 8 |
How to graph absolute value equations
\[y = -|x - 4|\]
Solution :
The given absolute value function is in the form :
\[y - k = |x - h|\]
That is,
\[y = -|x - 4|\]
To get the vertex, equate (x - 4) and y to zero.
\(x - 4 = 0\) and \(y = 0\)
\(x = 4\) and \(y = 0\)
Therefore, the vertex is
| \((4, 0)\) |
Because there is a negative sign in front of the absolute sign, we have to flip the curve over. This is an important function transformation.
So, the absolute value graph of the given absolute value function is
| Example 9 |
Graph the absolute value function given below.
\[y = -|x| + 2\]
Solution :
Write the given absolute value function in the form :
\[y - h = |x - h|\]
That is,
\[y = -|x| + 2\]
Subtract 2 from each side.
\[y - 2 = -|x|\]
To get the vertex, equate x and (y - 2) to zero.
\(x = 0\) and \(y - 2 = 0\)
\(x = 0\) and \(y = 2\)
Therefore, the vertex is
| \((0, 2)\) |
Because there is a negative sign in front of the absolute sign, we have to flip the curve over.
Hence, the graph of the given absolute value function is
| Example 10 |
Graphing absolute value function:
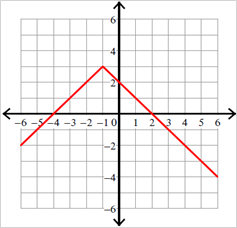
\[y = -|x + 1| + 3\]
Solution :
Write the given absolute value function in the form :
\[y - h = |x - h|\]
That is,
\[y = -|x + 1| + 3\]
Subtract 3 from each side.
\[y - 3 = -|x + 1|\]
To get the vertex, equate (x + 1) and (y - 3) to zero.
\(x + 1 = 0\) and \(y - 3 = 0\)
\(x = -1\) and \(y = 3\)
Therefore, the vertex is
| \((-1, 3)\) |
Because there is a negative sign in front of the absolute sign, we have to flip the curve over and apply the function transformation.
So, the absolute value graph of the given absolute value function is
| Example 11 |
Graphing absolute value equations
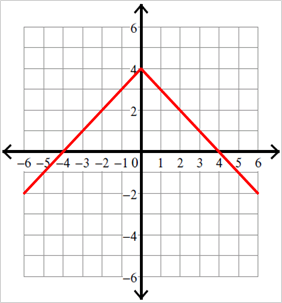
\[y = -|x| + 4\]
Solution :
Write the given absolute value function in the form
\[y - h = |x - h|\]
That is,
\[y = -|x| + 4\]
Subtract 4 from each side.
\[y - 4 = -|x|\]
To get the vertex, equate x and (y - 4) to zero.
\(x = 0\) and \(y - 4 = 0\)
\(x = 0\) and \(y = 4\)
Therefore, the vertex is
| \((0, 4)\) |
Because there is a negative sign in front of the absolute sign, we have to flip the curve over.
So, the absolute value graph of the given absolute value function is
| Example 12 |
Graphing absolute value equations.
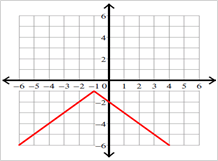
\[y = -|x + 1| - 1\]
Solution :
Write the given absolute value function in the form :
\[y - h = |x - h|\]
That is,
\[y = -|x + 1| - 1\]
Add 1 to each side.
\[y + 1 = -|x + 1|\]
To get the vertex, equate (x + 1) and (y + 1) to zero.
\(x + 1 = 0\) and \(y + 1 = 0\)
\(x = -1\) and \(y = -1\)
Therefore, the vertex is
| \((-1, -1)\) |
Because there is a negative sign in front of the absolute sign, we have to flip the curve over.
So, the absolute value graph of the given absolute value function is
Vertical and Horizontal shift in Modulus Function graph
How to move absolute value graphs?
Vertical and Horizontal Function Transformations
Have you ever tried to draw a picture of a rabbit, or cat, or animal? Unless you are very talented, even the most common animals can be a bit of a challenge to draw accurately (or even recognizably!). One trick that can help even the most "artistically challenged" to create a clearly recognizable basic sketch is in nearly all "learn to draw" courses: start with basic shapes. By starting your sketch with simple circles, ellipses, etc. the basic outline of the more complex figure is easily arrived at, then details can be added as necessary, but the figure is already recognizable for what it is.

The same trick works when graphing absolute value equations. By learning the basic shapes of different types of function graphs, and then adjusting the graphs with different types of transformations, even complex graphs can be sketched rather easily.
This section will focus on two particular types of transformations: vertical shifts and horizontal shifts.
We can express the application of vertical shifts this way:
Note : For any function \(f(x)\), the function \(g(x) = f(x) + c\) has a graph that is the same as \(f(x),\) shifted c units vertically. If c is positive, the graph is shifted up. If c is negative, the graph is shifted down.
Note: Adding a positive number after the x outside the parentheses shifts the graph up, adding a negative (or subtracting) shifts the graph down.
We can express the application of horizontal shifts this way:
Note: given a function \(f(x)\), and a constant a > 0, the function \(g(x) = f(x - a)\) represents a horizontal shift of a unit to the right from \(f(x).\) The function \(h(x) = f(x + a)\) represents a horizontal shift of a unit to the left.
Note: Adding a positive number after the x inside the parentheses shifts the graph left, adding a negative (or subtracting) shifts the graph right.
| Example 1 |
Below is the graphing of absolute value equationThe graph of \(y= |x|\) has been shifted right 3 units, vertically stretched by a factor of 2, and shifted up 4 units. This means that the corner point is located atfor this transformed function.
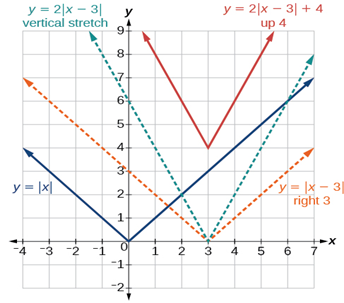
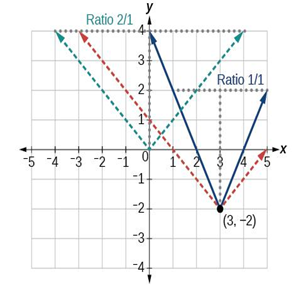
Writing an Equation for an Absolute Value Function Given a Graph. We also notice that the graph appears vertically stretched, because the width of the final graph on a horizontal line is not equal to 2 times the vertical distance from the corner to this line, as it would be for an unstretched absolute value function. Instead, the width is equal to 1 times the vertical distance as shown in (Figure).
From this information we can write the equation
Analysis
Note that these equations are algebraically equivalent—the stretch for an absolute value function can be written interchangeably as a vertical or horizontal stretch or compression.
If we couldn’t observe the stretch of the function from the graphs, could we
Write an equation for the function graphed in (Figure).
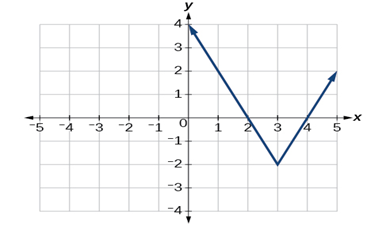
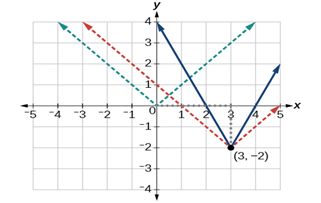
The basic absolute value function changes direction at the origin, so this graph has been shifted to the right 3 units and down 2 units from the basic toolkit function. See (Figure).
algebraically determine it?
Yes. If we are unable to determine the stretch based on the width of the graph \(f(x)=a|x-3|-2\)
Now substituting in the point \((1, 2)\)
\[\begin{align}2&=a|1-3|-2\\4&=2a\\a&=2\end{align}\]
Write the equation for the absolute value function that is horizontally shifted left 2 units, is vertically flipped, and vertically shifted up 3 units.
\[f(x)=-|x+2|+2\]
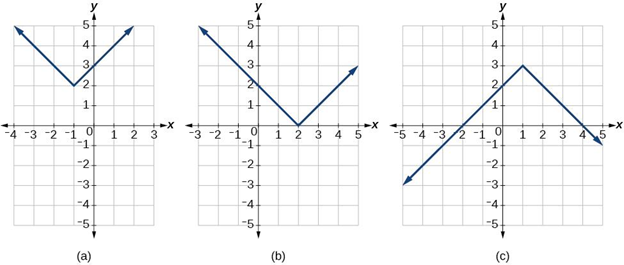
Do the graphs of absolute value functions always intersect the vertical axis? The horizontal axis?
Yes, they always intersect the vertical axis. The graph of an absolute value function will intersect the vertical axis when the input is zero.
No, they do not always intersect the horizontal axis. The graph may or may not intersect the horizontal axis, depending on how the graph has been shifted and reflected. It is possible for the absolute value function to intersect the horizontal axis at zero, one, or two points (see (Figure)).
(a) The absolute value function does not intersect the horizontal axis. (b) The absolute value function intersects the horizontal axis at one point. (c) The absolute value function intersects the horizontal axis at two points.
Summary
The process of graphing absolute value equations can be reduced to some specific steps which help develop any kind of absolute value graph. These can be achieved by first starting with the parent absolute value function, then shifting the graph according to function transformations, flip graph if necessary and even may have to compress or decompress the graph.
Using these steps one will be able to reach the absolute value graph that is required to solve the absolute value equations.
About Cuemath
Cuemath, a student-friendly mathematics and coding platform, conducts regular Online Classes for academics and skill-development, and their Mental Math App, on both iOS and Android, is a one-stop solution for kids to develop multiple skills. Understand the Cuemath Fee structure and sign up for a free trial.
Frequently Asked Questions (FAQs)
Over which interval is the graph of the parent absolute value function decreasing?
Answer: \((–∞, 0)\)