Discrete Data
In statistics, quantitative data is categorised into two types- discrete data and continuous data.
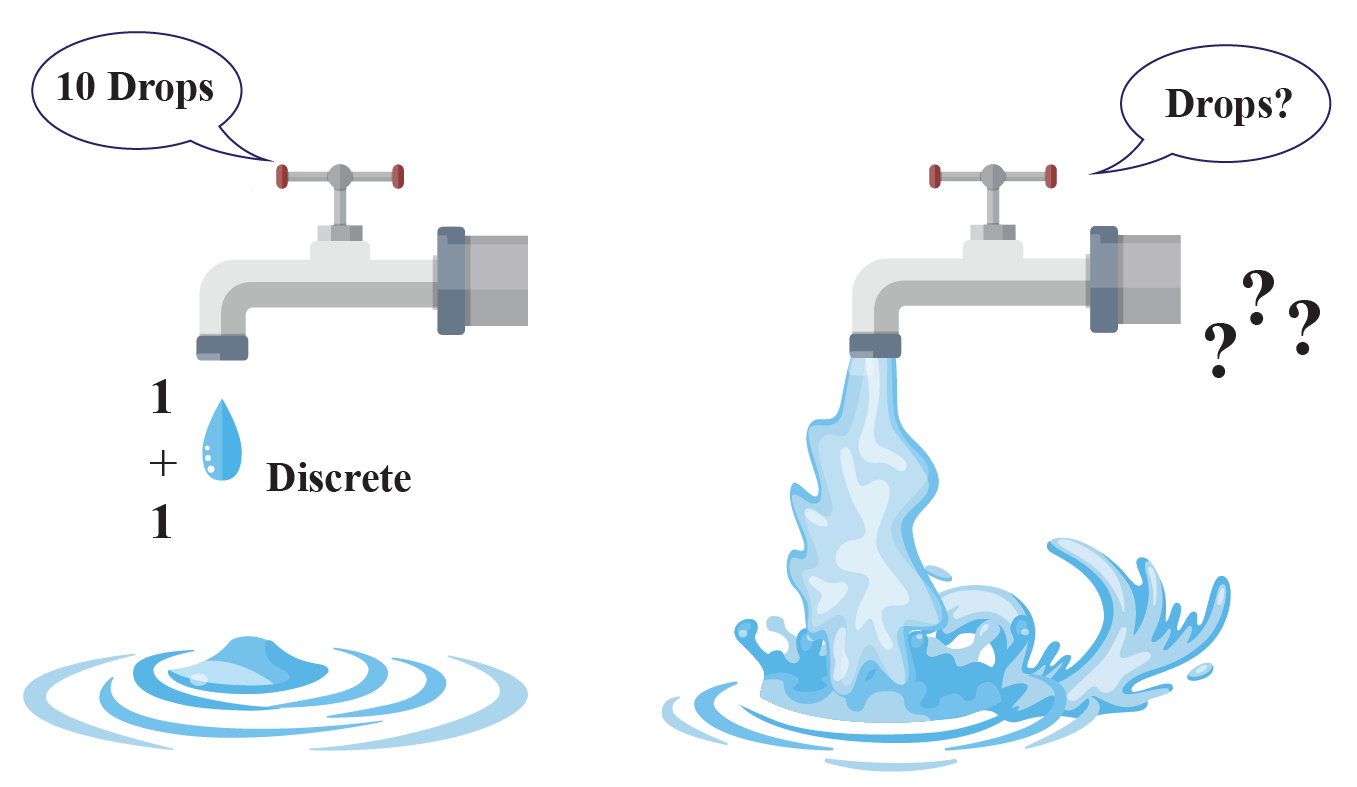
Carefully observe the image given below and try to interpret the meaning of discrete and continuous data.
Let's explore further.
In this mini-lesson, we will learn about discrete data definition, difference between discrete and continuous data and graphical representation of discrete data through visualization, some solved examples and a few interactive questions for you to test your understanding.
Lesson Plan
What Is Discrete Data?
The word data came from the Latin word 'Datum' which means “something given”.
After a research question is developed, data is being collected continuously through observation. Then it is organized, summarized, classified, and then represented graphically.
Data can be divided into two categories- Qualitative data and Quantitative data.
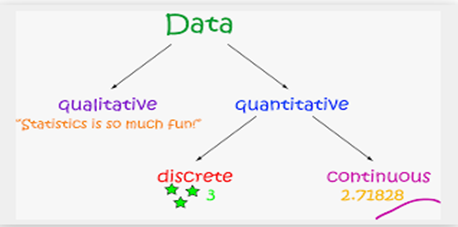
Among these two categories, quantitative data can be further classified into two types, discrete and continuous data. Now, let us look at discrete data definition.
When values in a data set are countable and can only take certain values, it is called discrete data. For example, number of students in a class, number of players required in a team, etc.
We can easily count the variables in a discrete data.
Now, let us learn about the difference between discrete and continuous data in the next section.
What Is the Difference Between Discrete and Continuous Data?
Let us understand the difference between discrete data v/s. continuous data through the following table:
| Discrete Data | Continuous Data |
| Variables can take only specific values. | Variables can take any value within a range. |
| We can count the values in a discrete data series. | We cannot count but measure the values in a continuous data series. |
| Whole numbers are used to write discrete data values. | Real numbers are used to used to write continuous data values. |
Examples
Some of the examples of discrete and continuous data are given in the table below:
| Discrete data | Continuous data |
|
Number of books in a bookshelf
|
Length of pages of books present in a bookshelf
|
|
Number of players participated in a race
|
Time taken by each player to finish the race
|
|
Number of students present in a class
|
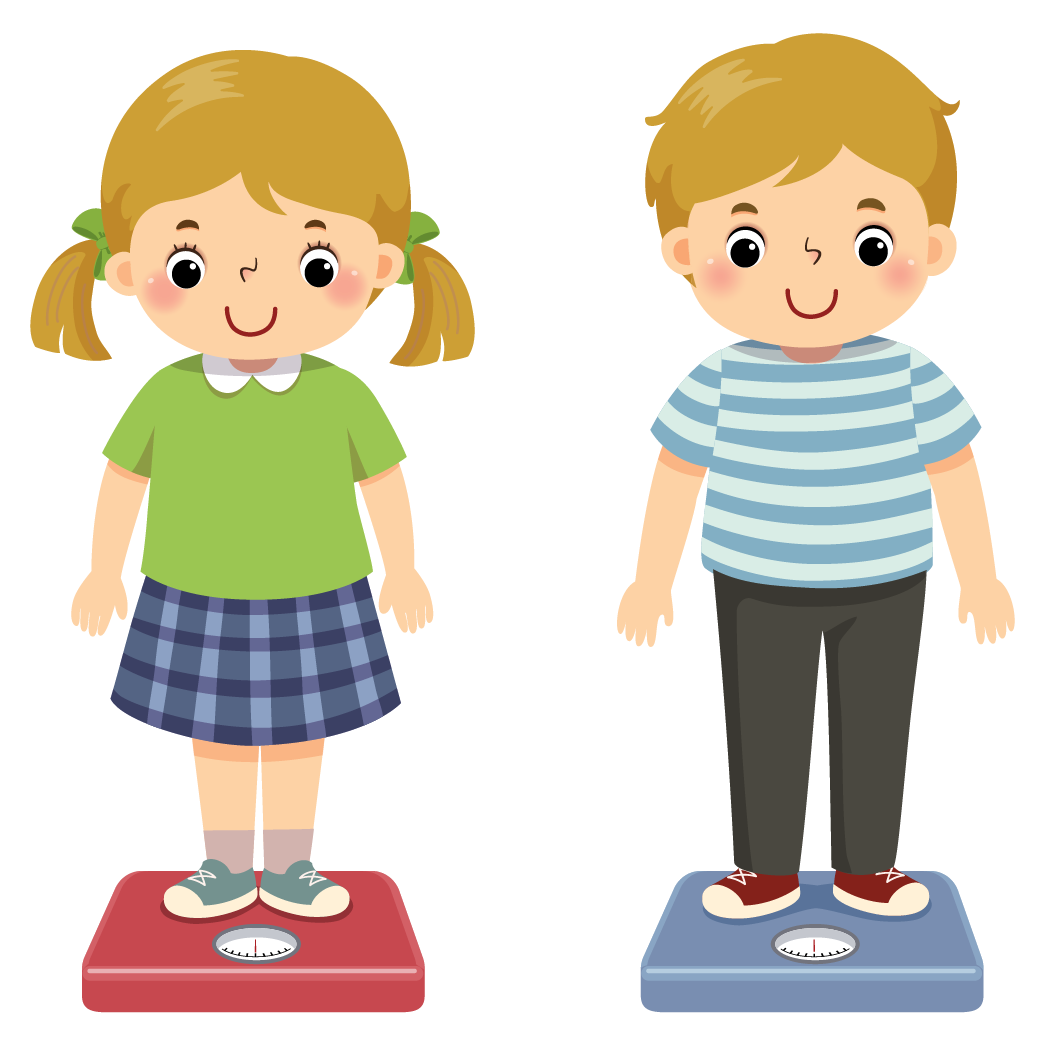
Weight of each student in a class
|


- Whenever you have to identify, whether a given data is discrete or not, just ask yourself a question:
"Can I count it?"
Graphical Representation of Discrete Data
Following types of graph can be used for graphical representation of discrete data:
- Bar Graph
- Frequency table
- Line plot(number line)
Bar graph is the most suitable way to represent discrete data, as finite values can be presented clearly through vertical or horizontal bars.
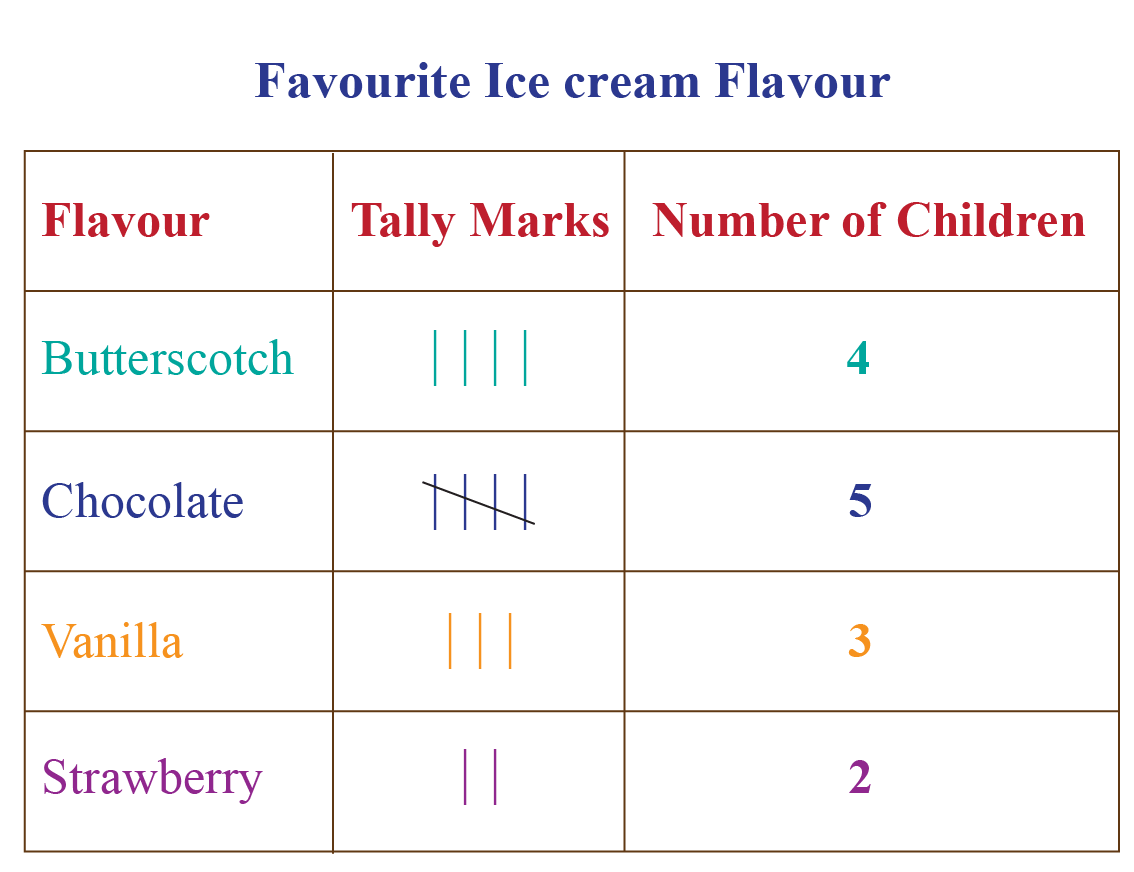
In frequency table, values are represented through tally marks and frequency of each variable.
On number line, we marked the value of each variable on the number line.
Let us take an example to understand it better.
Examples
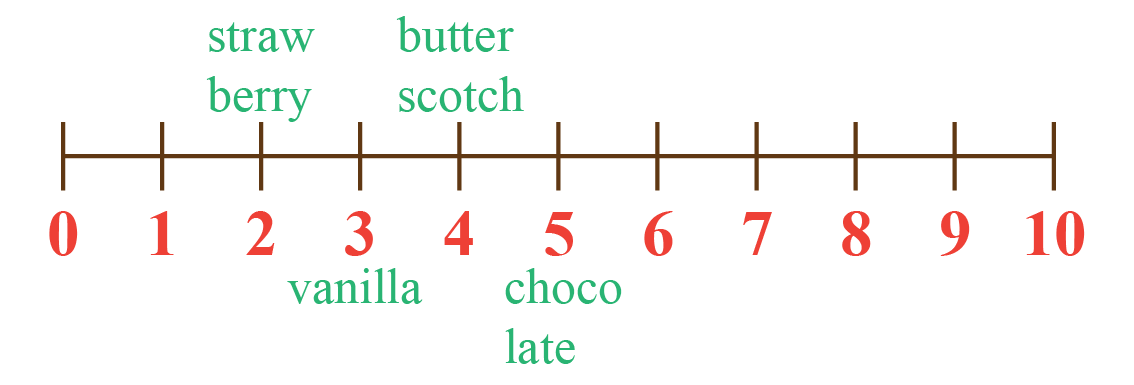
In a survey with 14 children on their favourite ice-cream flavour, it was found that 4 children like butterscotch flavour, 5 children like chocolate flavour, 3 children like vanilla flavour and 2 children like strawberry flavour of ice-cream.
It is an example of discrete data as we can count the number of children who like a particular flavour of ice-cream.
Carefully observe the graphical representation of this data through all three modes of representation.


- Data that can be counted and has finite values is known as discrete data. In discrete data, we can only move from one value to other as there is no value in between.
- Bar graph, frequency table and number line are the most common ways to represent discrete data.
- Among these, bar graph is the most suitable way for graphical representation of discrete data.
Solved Examples
| Example 1 |
Given below are the representation of two different sets of data in two different forms of graph. Find which one of the following represents discrete data and why?

Solution
Amon the two graphs, on the right side we have histogram and on the left side, we have bar graph.
Data given in bar graph represents discrete data as we consider number of girls class-wise in that graph that contains only finite values and is countable.
While data given in histogram represents continuous data as we consider marks obtained by students within a range in that graph. For example, 2 students obtained marks between 5 to 10, that means the marks could be any number within this range, for instance, 7.5, 5.25, 6, etc.
\(\, therefore, \) the data given in bar graph is a discrete data graph.
| \(\therefore\) The data given in bar graph represents discrete data. |
| Example 2 |
Look at the data given below of favourite sport of 58 people. Represent the data graphically and also write whether it is discrete data or not.
| Favourite Sport | Soccer | \(Basket\) \(ball\) | Tennis | Hockey | \(Base\) \(ball\) |
| Number of people | 18 | 14 | 10 | 4 | 12 |
Solution
Given data is an example of discrete data, as the values are given are whole numbers. We can count the number of people who like each sport.
Now, let us look at how to how to represent it through bar graph.
On the x-axis, we mention the names of favourite sport as it is an independent variable and on y-axis, we mention the number of people as it is a dependent variable.

| \(\therefore\) The given data is discrete and we represent it through bar graph. |
| Example 3 |
Classify the following variables in discrete and continuous.
- Sum of numbers obtained by rolling two dice at a time.
- Temperature recorded in NYC throughout the day.
- Number of workers in a company.
- Annual salary of all the workers in a company.
Solution
Sum of numbers obtained by rolling two dice at a time - It is a discrete data variable as the values obtained is finite and countable. Sum of the numbers obtained by rolling two dice can be {2, 3, 4, 5, 6, 7, 8, 9, 10, 11, 12}.
Temperature recorded in NYC throughout the day - It is a continuous data variable, as there is no fixed value for temperature. It can be \(2^o C\), \(2.56^o C\), \(4.75^o C\), etc.
Number of workers in a company - It is a discrete data variable, as the value is countable and finite.
Annual salary of all the workers in a company - It is a continuous data variable, as the annual salary is different for different employees in a company.
| \(\therefore\) Sum of numbers obtained by rolling two dice and Number of workers in a company are examples of discrete data. |
Interactive Questions on Discrete Data
Here are a few activities for you to practice. Select/Type your answer and click the "Check Answer" button to see the result.
Let's Summarize
The mini-lesson targeted the fascinating concept of discrete data. The math journey around discrete data starts with what a student already knows, and goes on to creatively crafting a fresh concept in the young minds. Done in a way that not only it is relatable and easy to grasp, but also will stay with them forever. Here lies the magic with Cuemath.
About Cuemath
At Cuemath, our team of math experts is dedicated to making learning fun for our favorite readers, the students!
Through an interactive and engaging learning-teaching-learning approach, the teachers explore all angles of a topic.
Be it worksheets, online classes, doubt sessions, or any other form of relation, it’s the logical thinking and smart learning approach that we, at Cuemath, believe in.
Frequently Asked Questions(FAQs)
1. Is salary a discrete or continuous variable?
Salary can be both discrete or continuous variable. It is discrete for organizations where there is a fixed salary for employees. But most commonly, we consider salary as a continuous variable as there is no defined range of salary.
2. Is age a discrete or continuous?
Age can be both discrete or continuous variable. It is continuous when we consider the exact age in terms of months and in days, on the other hand, it is discrete when we consider only the number of years.
3. Is weight discrete or continuous?
Weight is a continuous variable as its value is not a countable number. It is different for different people.
- Live one on one classroom and doubt clearing
- Practice worksheets in and after class for conceptual clarity
- Personalized curriculum to keep up with school