Linear Inequalities in Two Variables
In this mini-lesson, we will learn about infinite sets, ordered pairs, graph linear inequalities in two variables, greater than or equal to, less than or equal to, linear inequalities in two variables and graphing two variable inequalities.
But here's an interesting bit of trivia: Did you know that Thomas Harriot was the person who introduced the concept of inequalities in his book "Artis Analyticae Praxis ad Aequationes Algebraicas Resolvendas" in 1631.
Lesson Plan
What Are Linear Inequalities in Two Variables?
When one expression is given to be greater than or less than another expression, we have an inequality.
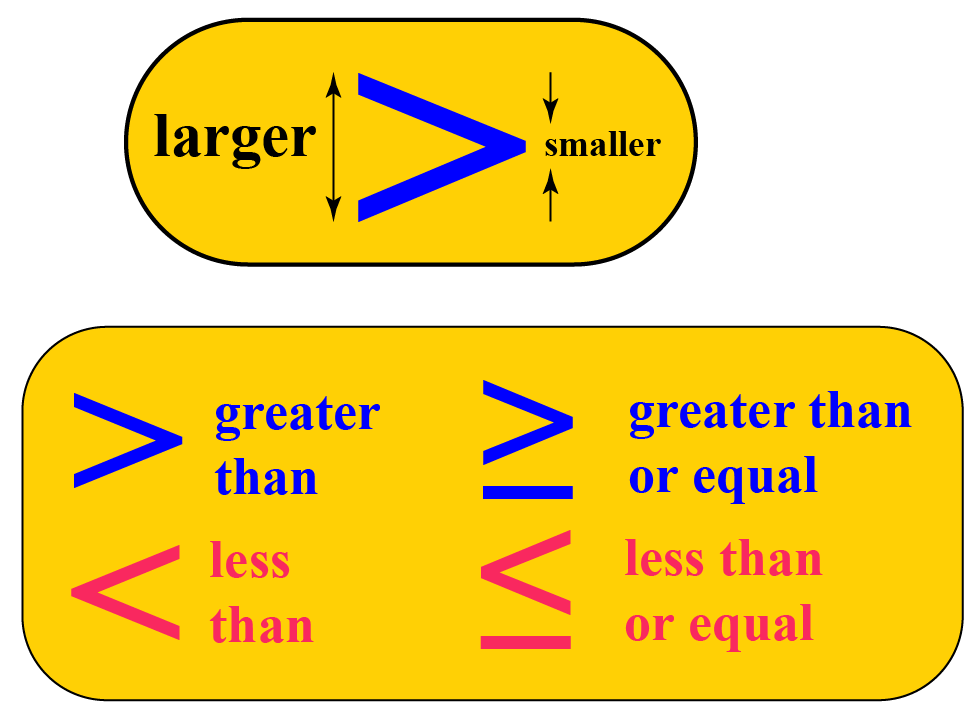
Linear inequalities are defined as expressions where two values are compared using inequality symbols. The symbols representing inequalities are:
Not equal (\(\neq\))
Less than (\(<\))
Greater than (\(>\))
Less than or equal to (\(\leq\))
Greater than or equal to (\(\geq\))
Linear inequalities in two variables represent the inequal relationship between two algebraic expressions which includes two distinct variables.
A linear inequality in two variables is formed when symbols other than equal to, such as greater than or less than are used to relate two expressions, and two variables are involved.
Here are some examples of linear inequalities in two variables:
\[\begin{array}{l}2x< 3y + 2\\7x - 2y > 8\\3x + 4y + 3 \le 2y - 5\\y + x \ge 0\end{array}\]
How Do You Solve Linear Inequalities With Two Variables?
The solution of a linear inequality in two variables, like Ax + By > C, is an ordered pair (x, y) that produces a true statement when the values of x and y are substituted into the inequality.
Solving linear inequalities is the same as solving linear equations; the difference it holds is of inequality symbol.
We solve linear inequalities in the same way as linear equations.
Step 1: Simplify the inequality on both sides, on LHS as well as RHS as per the rules of inequality.
Step 2: Once the value is obtained, we have:
- strict inequalities, in which the two sides of the inequalities cannot be equal to each other.
- non-strict inequalities, in which the two sides of the inequalities can also be equal.
Consider the following inequality:
\[2x +3y > 7\]
When we talk about finding the solution to this inequality, we are talking about all those pairs of values of x and y for which this inequality is satisfied. This means, for example, that \(x = 4,\;y = 3\) is one possible solution to this particular inequality. However, \(x = 0,\;y = 0\) is not, because when you substitute x and y equal to 0 on the LHS of the inequality, it turns out to be less than 7.
We saw that for any linear equation in two variables, there are infinitely many solutions. It might be obvious to you now that for any linear inequality as well, we will have infinitely many solutions. All these solutions will constitute the solution set of the linear inequality.

- PEMDAS and BODMAS play a crucial role in solving inequalities.
- If the number is negative on either side of a sign (not both), the direction stays the same.
How Do you Graph Inequalities With Two Variables?
Linear inequalities in two variables have infinite sets or infinitely many ordered pair solutions.
These ordered pairs or the solution sets can be graphed in the appropriate half of a rectangular coordinate plane.
In order to graph inequalities with two variables,
- Identify the type of inequality (greater than, less than, greater than or equal to, less than or equal to).
- Graph the boundary line - a dashed (in case of strict inequality) or a solid line (in case of non-strict inequalities).
- Choose a test point, most probably (0,0) or any other point which is not on the boundary.
- Shade the region accordingly. If the test point solves the inequality, shade the region that contains it. Otherwise, shade the opposite side of the boundary line.
- Verify with more number of test points in and out of the region.
Example: Graph the linear equality \[2x + 3y > 7\]
- Plot the straight line corresponding to the linear equation \(2x + 3y = 7\).
- Determine any two points (solutions) for this equation: two possible points on the graph can be taken as \(A\left( { - 1,\;3}\right),\,\,B\left( {2,\;1} \right)\) and plot them on the graph.
- Determine some specific solutions for the linear inequality \[2x + 3y > 7\], which can be as follows \begin{equation}(2,3), (3,1), (4.5,0), (0,3), (1.5,2)\end{equation}
- Plot these five points on the same graph.
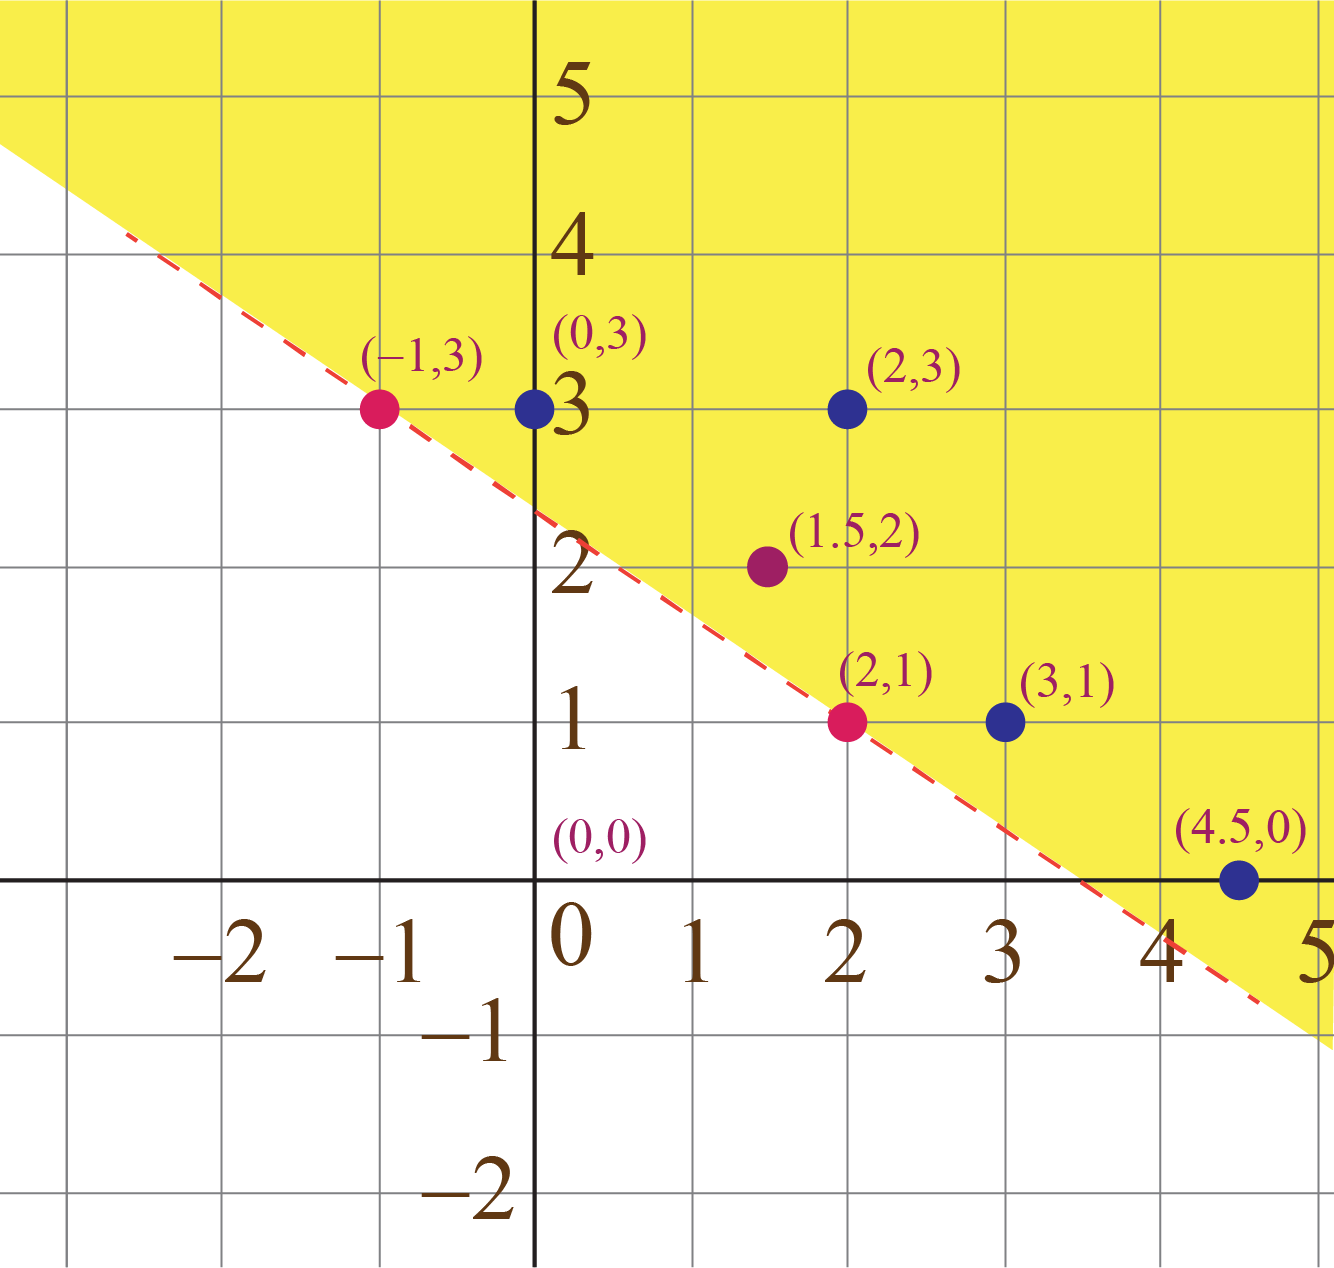
All the five points (corresponding to the five solutions) lie above the line.
- Take any point which lies above the line. Its coordinates, say \(\left( {{x_0},\;{y_0}} \right),\), will satisfy the inequality: \[2{x_0} + 3{y_0} >7\]
- This means that the solution set for the inequality consists of all points lying above the line.
- Put x = 0, y = 0, which gives 2(0) + 3(0) > 7, which further gives 0 > 7.This doesn't holds true for the given inequality. So, shade the half plane which doesn't include the point (0,0).

- Inequalities can be solved by adding, subtracting, multiplying, or dividing both sides by the same number.
- Dividing or multiplying both sides by negative numbers will alter the inequality's direction.
- Ordered pairs outside the shaded region don't solve linear inequalities.
- Less and greater than are strict inequalities while less than or equal to and greater than or equal to are not strict inequalities.
- Any line will divide the plane in which it lies into two half-planes.
- The solution sets of linear inequalities correspond to half-planes, while the solution sets of linear equations corresponds to lines.
Solved Examples
| Example 1 |
Help Bob to determine if (2,1/5) is a solution to \[2x + 5y < 10\]
Solution
Let's put these values (2,1/5) in the given linear inequality.
This gives \begin{equation}
2(2)+5(1 / 5)<10
\end{equation}
\begin{equation}4 + 1 < 10\end{equation}
\begin{equation}5 < 10\end{equation} which holds true.
| \(\therefore\) Thus (2,1/5) is the solution to \[2x + 5y < 10\] |
| Example 2 |
Brook's mother hands over $7 to him for chocolates. She tells him to spend only $7 or less than that.
A milk chocolate costs $2 while a nuts chocolate costs $33.
Let x be the number of milk chocolates and y be the number of nuts chocolates.
Form an inequality corresponding to the above situation and graph the inequality.
Solution
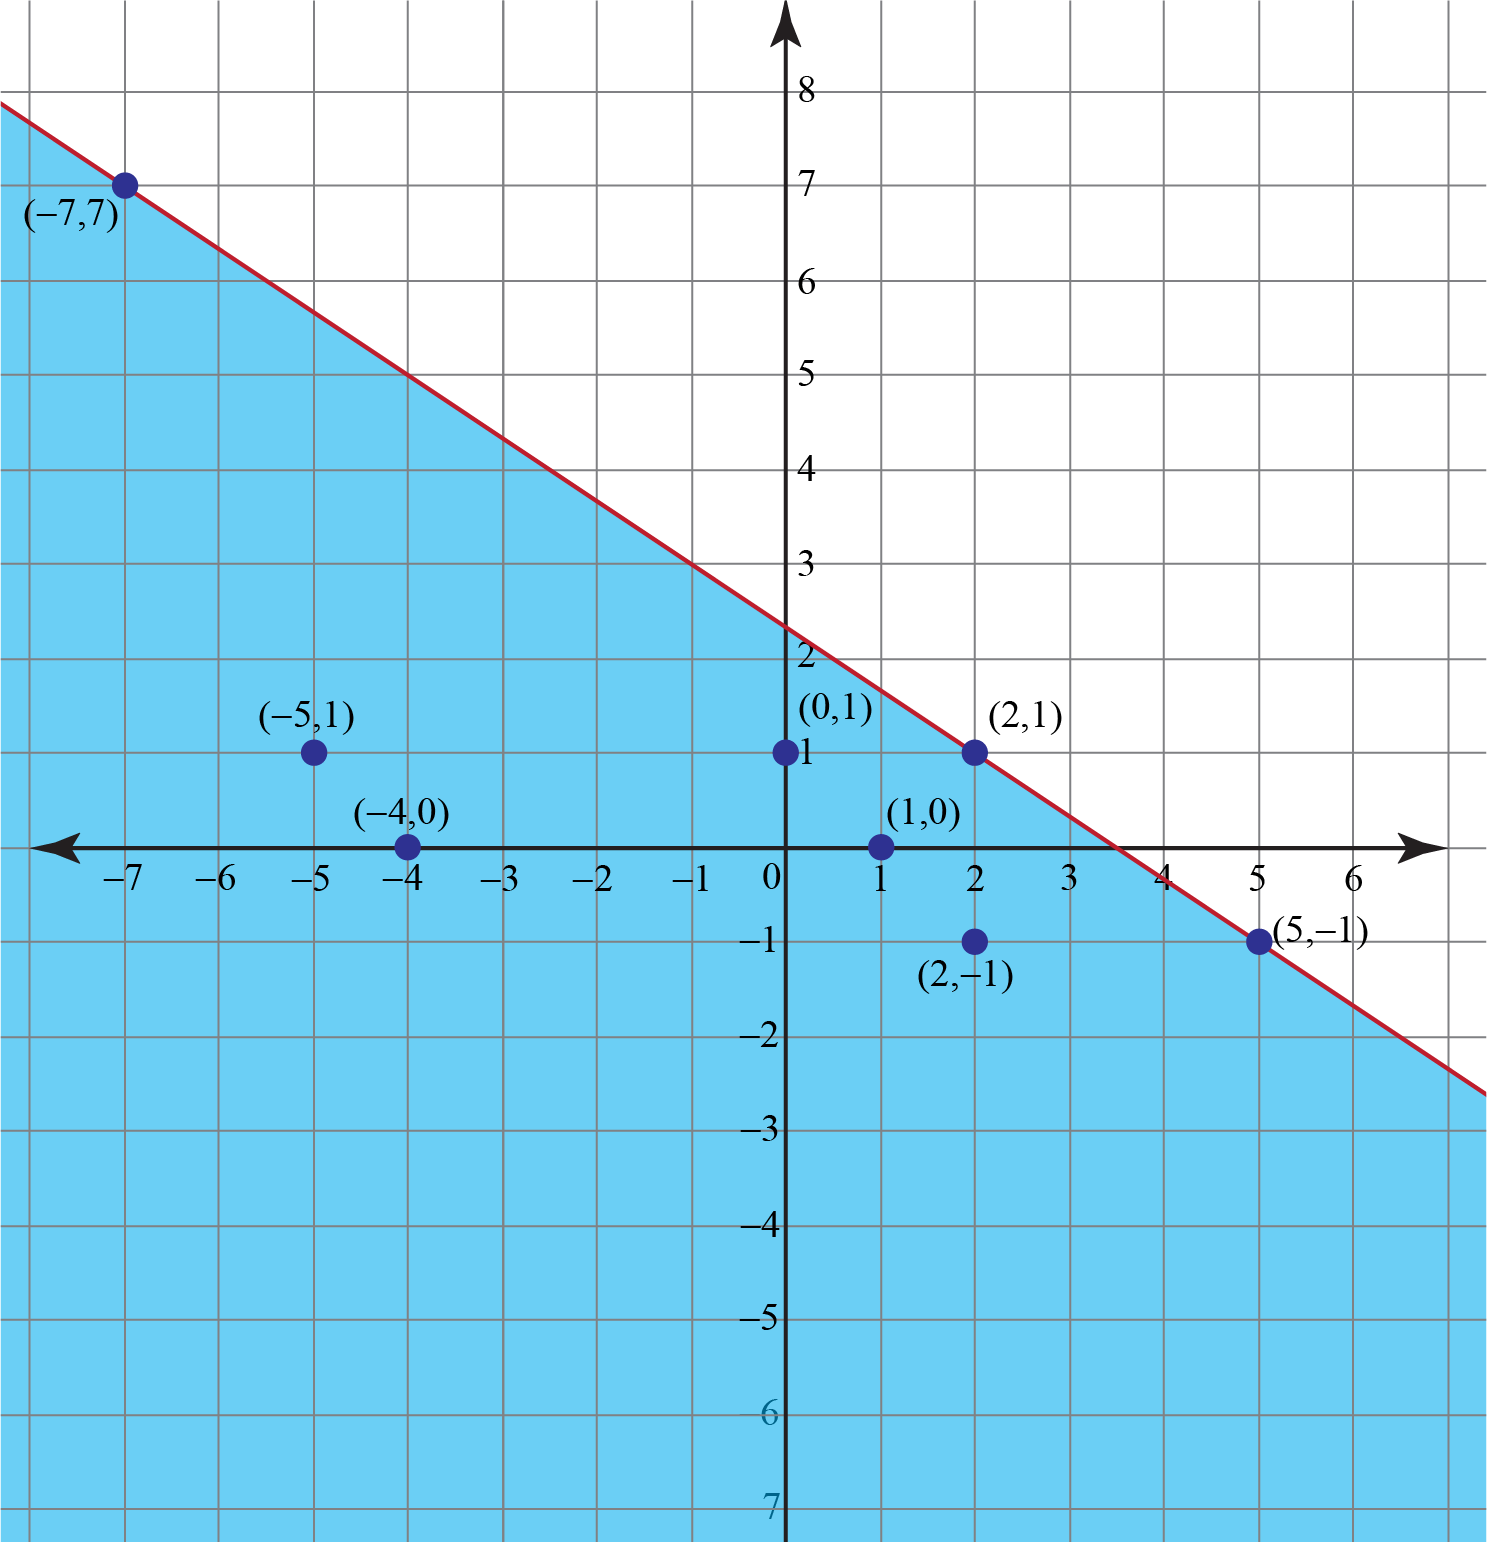
\[2x + 3y ≤ 7\] will be the inequality corresponding to the above situation.
In this case, we will plot a solid line as boundary joining the points which satisfy the linear equation \[2x + 3y=7\]
For \[2x + 3y=7\]
| x | 2 | 5 | -7 |
| y | 1 | -1 | 7 |
For inequality \[2x + 3y ≤ 7\]
- Determine some specific solutions for the linear inequality \[2x + 3y ≤ 7\] which can be as follows: \begin{equation}(0,1),(-4,0),(1,0),(-5,1),(2,-1)\end{equation}
- Plot these points. These will lie below the solid line.
Now, put x = 0, y = 0
This gives, 2(0) + 3(0) ≤ 7, which satisfies the inequality.
So, shade the half plane in the linear inequality graph below, which includes the point (0,0).
| Example 3 |
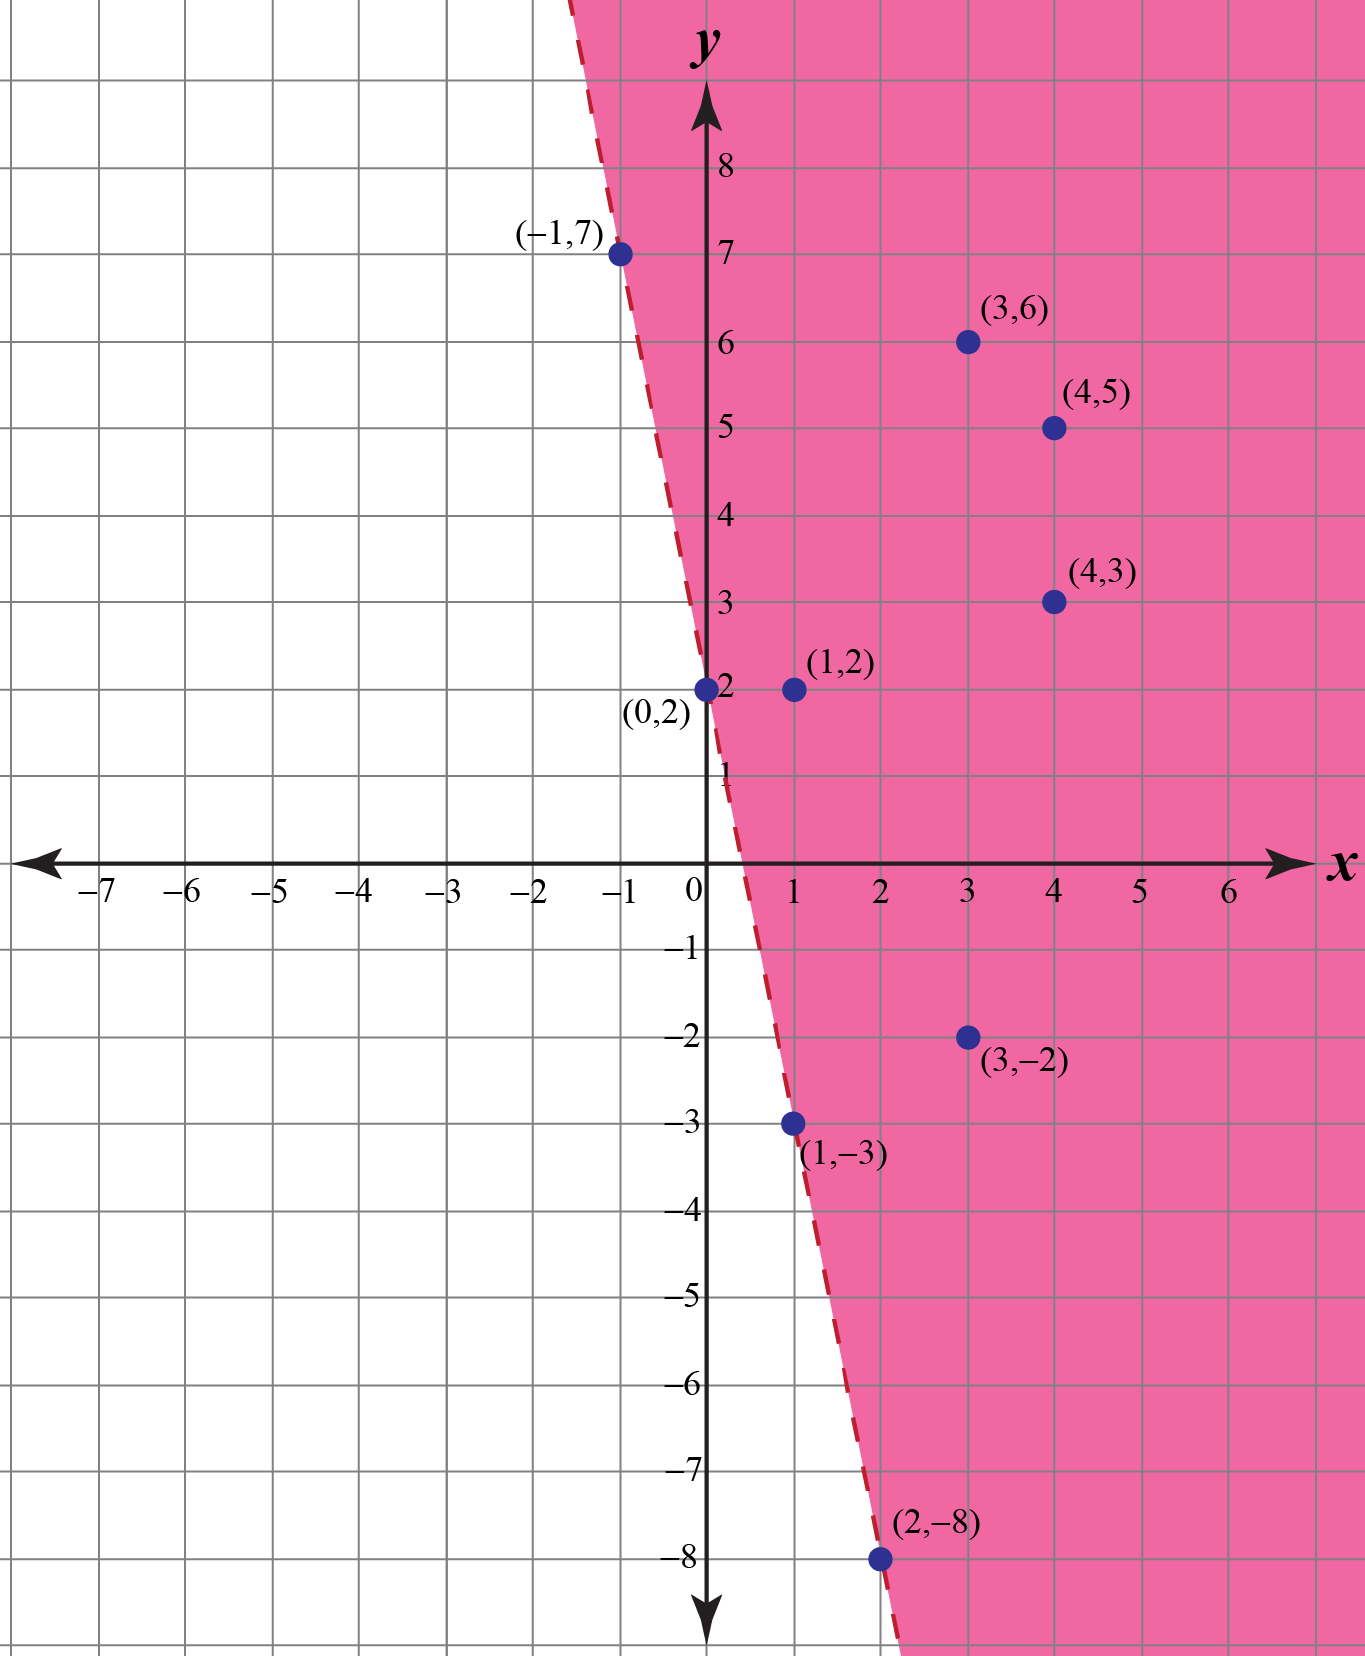
Graph the solution set for \[y > -5x + 2 \]
Solution:
\[y > -5x + 2 \] is an inequality in slope intercept form; slope=-5, intercept=2.
In this case, we will plot a dashed line because of a less than or equal to equality, as boundary joining the points which satisfy the linear equation \[y = -5x + 2\]
For \[y = -5x + 2\]
| x | 0 | 1 | 2 | -1 |
| y | 2 | -3 | -8 | 7 |
For the inequality\[y > -5x + 2 \]
- Determine some specific solutions for the linear inequality \[y > -5x + 2 \] which can be as follows: \begin{equation}(1,2), (3,-2), (4,3), (4,5), (3,6)\end{equation}
- Plot these points. These will lie above the dotted line.
For \[y > -5x + 2 \] put x=0, y=0
This gives 0>-5(0)+2
which further gives 0>2
This doesn't hold true for the given inequality. So, shade the half plane in the linear inequality graph below, which doesn't includes the point (0,0).
Interactive Questions
Here are a few activities for you to practice.
Select/Type your answer and click the "Check Answer" button to see the result.
Let's Summarize
We hope you enjoyed learning about what are linear inequalities with two variables, solving linear inequalities with two variables, graphing two variable inequalities, infinite sets, ordered pairs, greater than or equal to &, less than or equal to with interactive questions. Now, you will be able to easily find answers to linear inequalities with two variables and knowing about linear inequalities solutions.
The mini-lesson targeted the fascinating concept of linear inequalities in two variables. The math journey around linear inequalities in two variables starts with what a student already knows, and goes on to creatively crafting a fresh concept in the young minds. Done in a way that is not only relatable and easy to grasp, but will also stay with them forever. Here lies the magic with Cuemath.
About Cuemath
At Cuemath, our team of math experts is dedicated to making learning fun for our favorite readers, the students!
Through an interactive and engaging learning-teaching-learning approach, the teachers explore all angles of a topic.
Be it worksheets, online classes, doubt sessions, or any other form of relation, it’s the logical thinking and smart learning approach that we at Cuemath believe in.
FAQs on Linear Inequalities in Two Variables
1. What is a system of linear inequalities in two variables?
A system of linear inequalities in two variables refers to a set at least two linear inequalities in the same variables.
2. How do you differentiate linear inequalities in two variables from linear equations in two variables?
The graph of linear equations include a solid line in every situation, whereasin case of linear inequalities, the graph includes either a dashed line or a solid line. Also, linear inequalities include shaded regions but linear equations do not.
3. What is an example of a linear inequality?
An example Linear Inequality can be any linear equation but with symbols like <, >, ≤, or ≥ instead of an =.
4. What are the symbols used in linear inequalities?
The symbols used in linear inequalities are <, ≤, >, and ≥.
5. What is the meaning of linear inequalities?
A linear inequality is an inequality having a linear function, consisting of one of the symbols of inequality.
6. How do you identify a linear inequality?
When the two sides of an equation have sign other than equal to.
7. What is the use of linear inequalities?
A system of linear inequalities is often used to determine the maximum or minimum values of a situation with multiple constraints.
8. What are the 5 inequality symbols?
The five inequality symbols are ≠ = not equal to, > = greater than, < = less than, ≥ = greater than or equal to & ≤ = less than or equal to.
9. What does R mean in inequalities?
In inequalities, R corresponds to real numbers and includes all real numbers.